
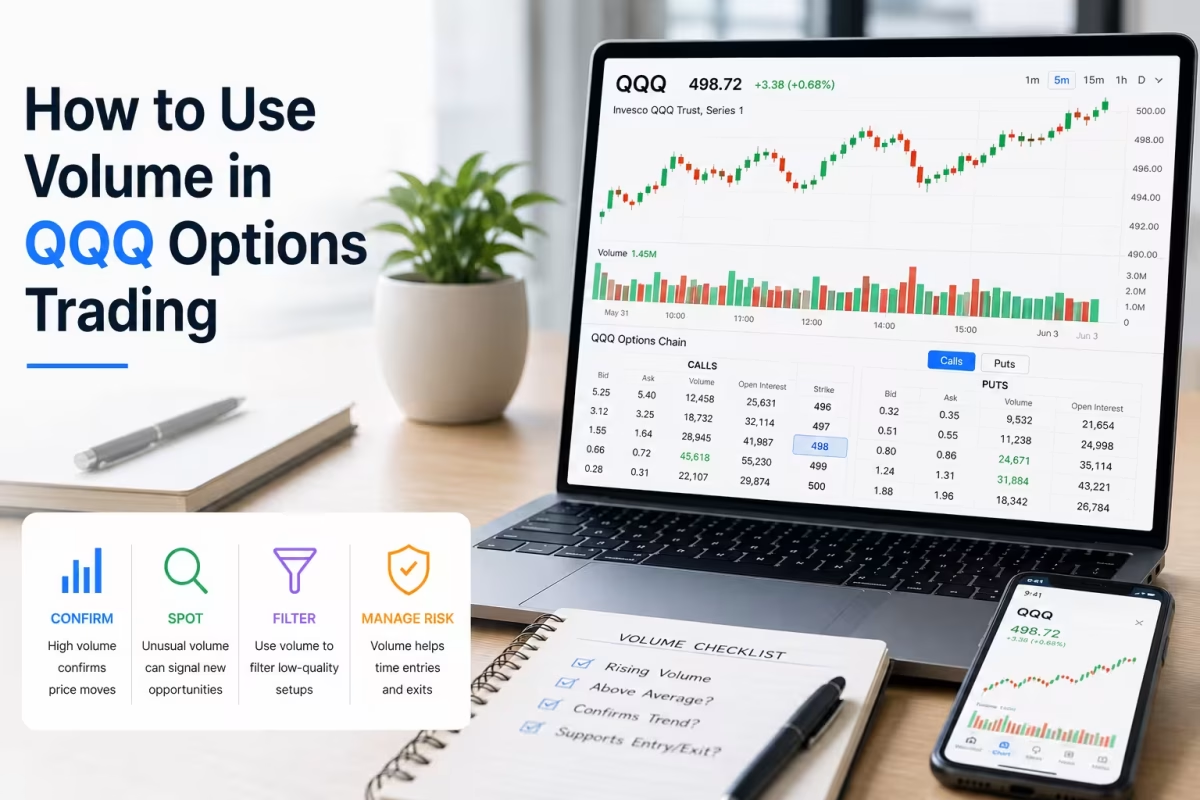
Volume is one of the most widely used tools in technical analysis — and also one of the most misread. Traders will stare at a price chart for an hour and never glance at the activity underneath it, even though QQQ options volume often tells you how much the market actually believes in the move it’s making.
For anyone trading the Invesco QQQ Trust, that matters more than usual. QQQ tracks the Nasdaq-100 and sits among the most actively traded ETFs in the U.S., so both the underlying shares and the options chain generate heavy daily activity. Reading that activity alongside price gives you a fuller picture than price alone ever will.
This guide covers how volume trading in QQQ actually works, how volume differs from open interest (a distinction that trips up a lot of newer traders), and how to fold both into a disciplined options strategy rather than treating volume as a standalone signal.
Why Volume Matters in QQQ Options Trading
Price tells you what the market did. Volume tells you how much conviction was behind it. Rising volume in QQQ options trading generally signals stronger buyer or seller commitment, while a move on thin volume often means the breakout — or breakdown — doesn’t have real support behind it yet.
Two quick examples make the difference obvious:
- A breakout above resistance on heavy volume carries far more credibility than the same breakout on a quiet, low-volume day.
- A sharp rally accompanied by declining volume can actually be a warning sign — momentum fading rather than building, even as price keeps climbing.
Volume shouldn’t be read in isolation. It earns its keep when paired with VWAP, RSI, and MACD, turning a vague “price is up” observation into something closer to a real thesis.
The key distinction to hold onto: volume doesn’t predict where price goes next. It helps you judge how much to trust the move that’s already happening.
The Three Types of Volume QQQ Traders Watch
QQQ traders typically track three different flavors of volume, and each answers a slightly different question.
ETF trading volume measures how many QQQ shares changed hands during the session. It tells you whether participation is building, whether a breakout is drawing in new buyers, or whether selling pressure is accelerating. Big jumps here usually line up with economic releases, Fed decisions, major tech earnings, or genuine trend days.
Options volume counts contracts traded, not shares — and it’s your best gauge of liquidity, interest in specific strikes, and how easily you’ll get in and out of a position. Higher options volume usually means tighter spreads and faster execution, though it’s worth remembering that high volume alone says nothing about whether traders are leaning bullish or bearish.
Volume Profile flips the usual time-based volume chart on its side, showing activity by price level instead. It surfaces high-volume nodes (where price has found acceptance), low-volume nodes (where price tends to move through quickly), and reasonably reliable support/resistance zones — useful for setting both profit targets and stops.
Volume vs. Open Interest: Why They’re Not the Same Thing
One of the more common mix-ups among newer options traders is treating volume and open interest as interchangeable. They’re not.
| Metric | Measures | Updates |
| Volume | Contracts traded today | Continuously through the session |
| Open Interest | Outstanding contracts still open | Typically once, after the close |
Here’s why the distinction matters in practice. Compare two hypothetical calls:
- Option A: 18,000 volume, 22,000 open interest
- Option B: 400 volume, 250 open interest
Option A is clearly the more liquid contract — easier to enter, easier to exit, tighter spread. Option B might look fine on a chart, but low volume and thin open interest usually mean a wider spread and higher real-world trading cost, even if the strike itself looks attractive.
How Volume Confirms (or Undermines) a Breakout
Genuine breakouts tend to come with a volume surge, because a real breakout needs broad participation to hold. A breakout on unusually light volume is more likely to fail — there simply isn’t enough buying or selling interest behind it to sustain the move.
Picture QQQ grinding below resistance for several sessions, then today: price clears that resistance, volume jumps well above its recent average, VWAP turns upward, and RSI climbs past 60. That combination reads as far more convincing than price alone breaking the level on a quiet, low-volume tape — in the second scenario, patient traders usually wait for extra confirmation before committing capital.
The MySpyOptions Volume Confirmation Framework™
Rather than reacting to price by itself, this framework runs every setup through five sequential checkpoints — price action, volume, technical validation, options confirmation, and risk. The underlying question shifts from “is price moving?” to “is the market actually participating in that move?”
- Price Action — Has QQQ established a real trend or breakout, or is this just noise inside a range?
- Volume Confirmation — Is trading activity rising alongside the move, or lagging behind it?
- Technical Validation — Do VWAP, RSI, MACD, or moving averages actually support the setup?
- Options Confirmation — Are volume, open interest, and liquidity in the options chain cooperating?
- Risk Management — Does the reward on offer justify the risk being taken?
How Institutional Activity Shows Up in Volume
Institutional traders rarely act on price alone, mostly because large orders are hard to fill without moving the market. That means unusually high trading activity often — though not always — accompanies meaningful buying or selling interest from bigger players.
Elevated volume by itself doesn’t prove institutional involvement. But when several things line up at once — above-average ETF volume, rising options volume, climbing open interest, sustained directional movement, and consistent trading above or below VWAP — the case for real participation (institutional or otherwise) gets stronger with each one.
Combining Volume With Other QQQ Technical Indicators
Volume rarely works as a standalone signal. It earns its value by validating whether a setup has real participation behind it — which is really the same philosophy behind our broader guide to QQQ technical indicators.
Volume + VWAP. A bullish read typically shows price above VWAP, rising volume, higher highs, and healthy option liquidity — buyers still in control. The bearish mirror: price below VWAP, increasing volume on the sell side, and lower highs, suggesting sellers are keeping the pressure on.
Volume + RSI. RSI measures momentum; volume tells you whether that momentum has real backing.
| RSI | Volume | Reading |
| Rising | Rising | Strong trend confirmation |
| Rising | Falling | Momentum may be weakening |
| Falling | Rising | Selling pressure building |
| Falling | Falling | Weak, low-conviction trend |
Volume + MACD. A bullish crossover on expanding volume is a materially stronger signal than the same crossover on fading volume — the crossover alone doesn’t tell you whether anyone showed up for it.
Volume + Moving Averages. When QQQ clears the 20 EMA, 50 EMA, or 200 EMA on expanding volume, that break tends to hold up better than one on thin participation.
Volume + Volume Profile. High-volume nodes frequently harden into support, resistance, or consolidation zones; low-volume areas are usually where price moves through fastest.
Reading QQQ Options Volume in the Options Chain
The options chain shows exactly where activity is concentrated across strikes and expirations — and combined with healthy open interest, high contract volume generally means better liquidity and lower execution costs.
Strike selection: favor active volume, tight bid-ask spreads, and adequate open interest. Steer clear of contracts with very low volume, wide spreads, or thin liquidity — they’ll cost you on both entry and exit, even if the setup itself is right.
Expiration selection: short-dated contracts can bleed Theta fast even during a strong directional move, so many active traders lean toward expirations with enough runway for the thesis to actually play out. (For more on matching expiration and Delta to an intraday setup specifically, see our QQQ intraday strategy guide.)
Implied volatility: high IV inflates premium regardless of volume, so volume, open interest, IV, Delta, and Theta all need to be checked together — not one in isolation.
The Complete Volume Confirmation Workflow
Step 1 — Identify market direction. Is QQQ trending higher, trending lower, or consolidating? Reading volume before understanding structure tends to produce false signals.
Step 2 — Confirm participation. Is today’s volume running above average? Is it building as the session progresses? Are buyers or sellers becoming more aggressive?
Step 3 — Validate with technical indicators. Confirm using VWAP, RSI, MACD, moving averages, support/resistance, and Volume Profile.
Step 4 — Evaluate the options chain. Check contract volume, open interest, bid-ask spread, Delta, expiration, and implied volatility together.
Step 5 — Define risk. Maximum loss, profit target, stop-loss, position size, and risk-to-reward ratio should all be set before the trade goes on, not after.
Volume should strengthen a trading thesis you already have — not manufacture one from scratch.
Volume Decision Matrix
| Market condition | Volume | Interpretation | Possible action |
| Breakout | High | Strong confirmation | Consider entry after confirmation |
| Breakout | Low | Weak participation | Wait for confirmation |
| Pullback | Low | Healthy retracement | Monitor for continuation |
| Pullback | High | Heavy selling pressure | Exercise caution |
| Sideways | Low | Market indecision | Wait for a clearer setup |
| Trend | Rising | Sustained participation | Manage the existing position |
A Practical Example
Say QQQ has spent several sessions stuck in a narrow range, then opens stronger on the back of positive tech earnings. Over the next hour: QQQ clears resistance, ETF volume runs above its recent daily average, price holds above VWAP, RSI climbs past 60, and MACD confirms bullish momentum. Near-the-money calls show a jump in volume alongside healthy open interest.
Instead of chasing the breakout candle, a disciplined trader waits for a small pullback toward the breakout level. That pullback happens on noticeably lighter volume — a sign of profit-taking rather than real selling pressure. Once buyers step back in, the entry goes on with a stop below the breakout level and a target set for at least a 2:1 reward-to-risk ratio.
That sequence is really the whole point of this guide: volume as one input in a disciplined process, not a signal traded on its own.
Common Mistakes When Reading Volume
Treating every spike as bullish. Volume reflects activity, not direction — a huge volume spike can just as easily mark capitulation selling as a breakout.
Ignoring open interest. High volume paired with very low open interest doesn’t guarantee the liquidity a trader expects.
Fighting market structure. Volume can’t rescue a technically weak setup — check the trend first, always.
Overlooking news events. Fed announcements, CPI releases, and major tech earnings routinely distort normal volume patterns for a session or two.
Skipping risk management. Even a well-confirmed, high-volume setup can fail. Position sizing still matters every single time.
Volume Trading Checklist
Before placing a QQQ options trade, run through this:
- Is the overall trend clear?
- Is volume confirming price?
- Does VWAP support the move?
- Is RSI aligned with the direction?
- Does MACD confirm momentum?
- Is the options contract itself liquid?
- Is open interest healthy?
- Has implied volatility been evaluated?
- Is the stop-loss defined?
- Does the trade offer at least a 2:1 reward-to-risk ratio?
Learn QQQ Options Trading with MySpyOptions
Reading a chart is only part of the job. Consistent traders also understand how volume, liquidity, options pricing, and risk management interact — which is exactly the gap this guide, along with our posts on QQQ technical indicators and QQQ intraday strategy, is meant to close.
MySpyOptions builds structured education around QQQ and SPY options: reading the options chain, the Greeks, volume and liquidity analysis, position sizing, and trade planning grounded in risk management rather than predictions. If contract basics are still new, our guide on calls versus puts is a good starting point, and for faster-paced approaches, see our post on options scalping strategies. More guides are available on the MySpyOptions blog.
Key Takeaways
QQQ options volume measures the participation behind a price move — but it needs to be read alongside price action, not in place of it. ETF volume, options volume, and Volume Profile each surface a different angle on the same underlying activity. Pairing volume with VWAP, RSI, MACD, and moving averages meaningfully improves trade confirmation, and open interest fills in the liquidity picture volume alone can’t provide. A structured process — like the Volume Confirmation Framework™ above — is what turns all of this into something repeatable instead of a set of disconnected observations.
Frequently Asked Questions
What does high QQQ options volume indicate?
It means a large number of contracts changed hands during the session, usually pointing to stronger interest and better liquidity. On its own, though, it doesn’t tell you direction — pair it with price action and open interest before drawing conclusions.
Is volume more important than open interest?
Neither outranks the other — they measure different things. Volume shows current activity; open interest shows outstanding positions. Together they give a fuller read on liquidity and participation than either alone.
Which indicators work best with QQQ options volume?
VWAP, RSI, MACD, moving averages, and Volume Profile are the most common pairings. Using several together reduces the risk of leaning on one signal that turns out to be noise.
Can volume predict market direction?
No — volume doesn’t forecast where price goes next. It helps confirm whether buyers or sellers are genuinely backing the move that’s already underway.
Why does volume matter for day trading QQQ options?
Intraday traders use volume trading in QQQ to judge whether a breakout, reversal, or pullback has real participation behind it, which tends to improve confidence at both entry and exit.
How is Volume Profile different from regular volume?
Standard volume shows activity over time; Volume Profile shows where that activity happened across price levels — which makes it especially useful for spotting support, resistance, and zones of price acceptance.