myspyoptions.com

Categories
Finance Options Trading

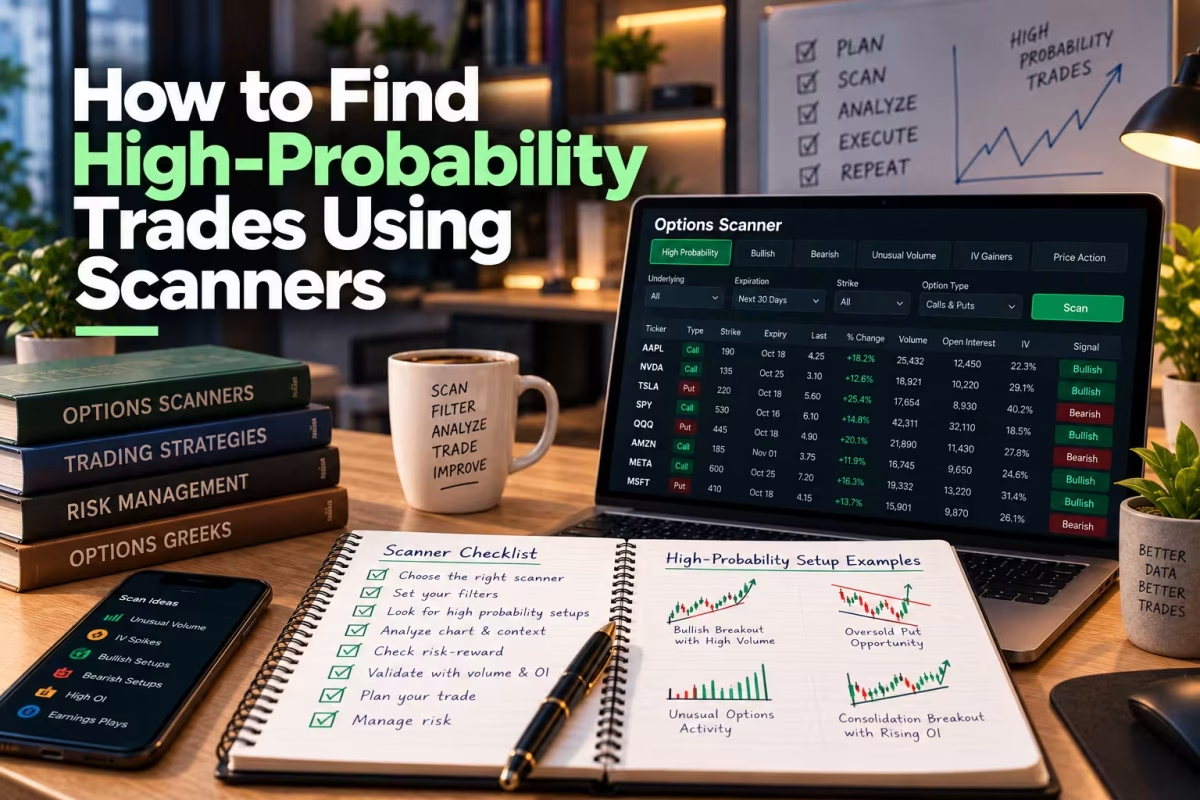
How to Find High-Probability Trades Using Scanners

An options scanner can save you hours of digging through hundreds of contracts. But finding a setup and finding a good trade are two different things — and that gap is exactly where most scanner-based strategies fall apart. A solid options scanner strategy doesn’t stop at the alert. It uses the scanner to narrow the field, then applies a consistent process — liquidity, price action, implied volatility, technical confirmation, contract selection, and risk management — to decide whether what the scanner found is actually worth trading.

Quick answer: An options scanner strategy is a rules-based way of using a scanner to filter thousands of contracts down to a short list, then confirming each candidate against the underlying’s price action before you ever look at strike or expiration. The scanner’s job is to reduce how many decisions you have to make — not to make the trading decision for you.

What Is an Options Scanner Strategy?

At its core, an options scanner strategy is a rules-based process for identifying contracts or market conditions that match criteria you’ve already decided matter — volume, open interest, implied volatility, Delta, expiration, price, or unusual activity. Instead of hunting randomly through an options chain, you set the filters first and only investigate the candidates that actually clear them.

Think of the scanner as an idea-generation and filtering tool, not a decision-maker. It can surface a contract that looks great on paper and still be wrong for you — poor liquidity, inflated implied volatility, no technical confirmation, or a risk-to-reward ratio that doesn’t hold up once you look closer.

A practical version of the workflow looks like this: scan the market for potential setups, filter using liquidity and strategy-specific criteria, confirm the underlying with price action and technicals, select the right strike and expiration, define your risk, and only then execute — or reject — the setup based on your own rules. The goal isn’t to find the most active option on the board. It’s to find the option that satisfies your complete setup.

The Three Types of Options Scanners (And When Each One Fits)

Not every scanner is solving the same problem, so it’s worth being specific about what you actually want yours to find.

Criteria-based scanners search using predefined characteristics — Delta, Theta, Gamma, Vega, implied volatility, IV rank, open interest, volume, days to expiration, strike price. These are most useful once you already have a strategy. If you want SPY calls in a particular Delta range with a specific expiration, you don’t need an unusual-flow scanner — you need a criteria-based one.

Unusual activity and options-flow scanners flag large trades, sweeps, blocks, unusual volume, oversized estimated premium, and volume relative to open interest. They’re excellent for generating ideas and spotting where attention is building, but they won’t tell you whether a trade was opened, closed, hedged, or built as one leg of a spread.

Alert-based watchlist scanners monitor a limited group of symbols and notify you when specific conditions trigger. For an SPY and QQQ trader, this can be particularly efficient, since your universe is intentionally small — you’re watching two tickers, not two thousand. That lets you track things like price relative to VWAP, breakouts, volume expansion, options volume, IV shifts, and key support/resistance levels without drowning in noise.

The best scanner is the one that matches your process. A flow scanner is built for finding unusual activity; a criteria-based scanner earns its keep once you already know what characteristics your strategy needs.

Building a High-Probability Options Scan

“High probability” gets thrown around loosely, so it’s worth being precise: no scanner can guarantee a winning trade. What you can build is a setup where several independent conditions all point the same direction — which is a meaningfully different, more honest goal.

Step 1: Start with the underlying, not the option

Before you ever look at a contract, look at SPY or QQQ itself. Is the market trending or ranging? Is price above or below VWAP? Where do the major support and resistance levels sit? Is volume expanding, and is momentum strengthening or weakening? Is there a major economic event on the calendar? Skipping this step is how traders end up falling for an attractive-looking option in a market environment that doesn’t actually support the trade.

Step 2: Apply liquidity filters before anything else

Liquidity is one of the most important — and most commonly ignored — scanner filters. You want adequate options volume, adequate open interest, tight bid-ask spreads, and a contract you can realistically enter and exit. A theoretically great trade becomes a headache to manage if the spread eats your edge before you’re even filled. SPY and QQQ are generally more liquid than most individual-stock options, but that doesn’t mean every strike and expiration on the chain is equally efficient — some corners are still thin.

Step 3: Choose the expiration to match the thesis, not the premium

The wrong question is “which expiration makes this option cheapest?” The right one is “how much time does my thesis actually need to play out?” An intraday momentum idea usually wants same-day or very short-dated options; a short swing might need several days to a few weeks; a bigger directional thesis benefits from more time; premium-selling strategies often run longer than an intraday setup; and an event-driven trade should have its expiration chosen around the catalyst and volatility itself. Short-dated contracts react fast, but that speed comes with real sensitivity to time decay and shifting Delta and Gamma — worth remembering before you reach for the cheapest strike on the board.

From Scanner to Chart: The Confirmation Framework

One of the single biggest upgrades you can make to an options scanner strategy is simply separating discovery from confirmation. The scanner finds the candidate. The chart decides whether that candidate deserves your attention.

Bullish example: Say an SPY scanner flags increasing call volume, strong options liquidity, a concentrated expiration, and rising underlying volume. That’s not a green light to buy a call yet. First check whether SPY is holding above an important support level, trading above VWAP, forming higher highs and higher lows, showing expanding volume during the move, and has room before the next major resistance. If the options signal and the price structure agree, the setup earns a closer look. If SPY is failing resistance and losing VWAP at the same time the scanner lit up, that signal deserves a lot less weight than it first appeared to carry.

Bearish example: QQQ shows unusually high put activity. Before acting, check whether QQQ is below VWAP, whether support has actually broken, whether selling volume is increasing, whether momentum is weakening, and whether the move is showing up across the broader Nasdaq-100 rather than in isolation. You’re looking for confluence — multiple things agreeing — not a reason to confirm what you already wanted to believe.

SPY vs. QQQ: Why One Scanner Setting Doesn’t Fit Both

A single scanner configuration shouldn’t be applied blindly to every underlying you trade. SPY represents broad S&P 500 exposure; QQQ tracks the Nasdaq-100, and Nasdaq itself describes QQQ as one of the principal ETF vehicles providing exposure to that index — 100 of the largest non-financial companies listed on Nasdaq. That structural difference is exactly why QQQ often reacts differently than SPY when growth and technology sentiment shifts.

Factor SPY QQQ
Underlying S&P 500 Nasdaq-100
Market context Broad U.S. equity market Large-cap, technology-heavy growth exposure
Useful confirmation SPY trend, VWAP, breadth, macro levels QQQ momentum, technology leadership, Nasdaq levels
Important catalysts Fed, CPI, jobs data, broad macro news Rates, technology earnings, Nasdaq momentum
Scanner approach Emphasize market-wide conditions Weight momentum and technology-sector context more heavily

Using the Greeks to Choose the Right Contract

Once the scanner surfaces a candidate, the next question is whether that specific contract actually expresses your thesis efficiently. Delta approximates sensitivity to a move in the underlying; Gamma measures how quickly Delta itself changes; Theta measures sensitivity to time passing; Vega measures sensitivity to implied volatility. Don’t pick a contract just because it shows the highest potential percentage return — work backward instead, from market view, to desired exposure, to the volatility environment, to expiration, to Delta, to risk. An aggressive short-term trader might prefer more Gamma exposure; someone with a longer-duration thesis usually prioritizes extra time to expiration instead.

Implied volatility deserves its own pause here. IV represents the market’s expectation of future price variability, priced directly into the option. A scanner can hand you a contract with attractive directional characteristics that’s simply expensive because IV happens to be elevated right now — which raises a question worth asking every time: is the idea correct, but the option itself poorly priced for the current environment? That’s exactly why contract selection should happen after the underlying thesis is established, not before.

A 7-Point Scanner Checklist Before You Enter

Run through this before acting on anything a scanner flags:

  1. Market — What is SPY or QQQ actually doing right now? Trending, reversing, or ranging?
  2. Setup — What caused the scanner to flag this contract in the first place?
  3. Confirmation — Does price action agree with the signal?
  4. Contract — Is the strike and expiration appropriate for the thesis?
  5. Quality — Are liquidity, IV, and the Greeks acceptable?
  6. Risk — Where is the trade invalidated, and how much capital is on the line?
  7. Fit — Does this actually match your existing trading rules, or are you bending the rules to fit the alert?

If several of these come back unclear, the scan has still done its job — it found something worth investigating. That’s not the same as finding something worth trading.

Common Scanner Mistakes Worth Avoiding

Chasing the highest volume on the board is a natural instinct, but activity alone isn’t an edge — ask why the volume is elevated and whether the underlying actually confirms it. Piling on dozens of filters can backfire the other way, producing a clean-looking list with almost nothing usable in it; start with the handful of variables that genuinely matter to your strategy and resist the urge to add more.

Bid-ask spreads get ignored more often than they should. A contract can show impressive volume and still carry an inefficient spread that quietly eats your edge — always check the actual quote before entering, not just the headline volume number. Scanner “scores” are another trap: a number is only as good as the methodology behind it, and a score without a visible methodology shouldn’t replace your own judgment.

Cheap out-of-the-money options look tempting precisely because they’re cheap, but low premium doesn’t mean good value — an inexpensive option can carry a genuinely low probability of finishing profitable, especially if the underlying needs a large move before expiration. Time decay compounds this: a trade can be directionally right and still lose money if the underlying doesn’t move fast enough, and that pressure only intensifies as expiration nears. And perhaps the most common mistake of all is letting the scanner override the plan — the scanner should fit your strategy, not the other way around. Your rules shouldn’t change every time a new alert fires.

A Repeatable Daily Workflow for SPY and QQQ Traders

Before the open: review the economic calendar, any major overnight moves, current SPY and QQQ levels, the previous day’s high and low, key support and resistance, expected volatility, and any scheduled catalysts.

During the session: run your scanner for volume expansion, unusual options activity, liquidity, technical breakouts, VWAP conditions, IV changes, and relevant Delta ranges.

Before entry: move from the scanner to the chart and ask whether the underlying confirms the options signal. If yes, examine the contract itself. If no, wait — there’s no rule that says every alert needs a trade attached to it.

After entry: define your stop-loss or technical invalidation level, profit target, maximum acceptable loss, position size, exit conditions, and maximum holding period.

Strung together, that’s a complete process — not a pile of disconnected indicators you’re reacting to one at a time.

Learn Scanner-Based SPY and QQQ Trading with MySpyOptions

A scanner is easiest to use well when it’s treated as one piece of a broader trading system rather than the whole system. MySpyOptions focuses specifically on SPY and QQQ options, combining market analysis, technical concepts, options-strategy education, and live-market learning — with an emphasis on practical trade selection, risk management, strike and expiration selection, and reading price action, rather than leaning on alerts alone.

That distinction tends to matter most for newer traders. A scanner can show you what happened. Working through the reasoning with experienced traders helps you understand why a setup matters, when it’s invalid, and how the option should actually be structured around the thesis — which also tends to reduce the temptation to rewrite your scanner settings or trading rules after every losing trade.

For traders focused specifically on SPY and QQQ, MySpyOptions’ approach is built around SPY- and QQQ-specific market analysis, practical options strategies, live-market examples, technical analysis, contract and expiration selection, position sizing and risk management, and ongoing trader support and mentorship. The goal was never to make you dependent on a scanner or an alert service — it’s to help you learn how to evaluate the setup yourself.

What Actually Makes a Scanner-Based Trade High-Probability?

A scanner can’t make a trade high-probability on its own. A more honest definition: a high-quality scanner setup is one where several independent factors point to the same thesis, and the potential reward justifies the defined risk. Picture it as a chain — scanner signal, then market context, then technical confirmation, then contract selection, then risk control. As an example: QQQ call activity shows up → the broader Nasdaq environment is bullish → QQQ is holding above VWAP → a breakout confirms it → you select a suitable Delta and expiration → you set a predefined stop before entering.

Each link in that chain is handling a different type of uncertainty. The scanner handles discovery. Technical analysis handles timing and market structure. The Greeks and IV help with contract selection. Position sizing handles risk. Put together, that’s the actual purpose of an options scanner strategy — not finding the loudest alert on the screen, but building a repeatable filter for genuinely well-supported setups.

Frequently Asked Questions

What is an options scanner strategy?

An options scanner strategy is a rules-based process for using a scanner to find contracts that match predefined conditions — volume, open interest, implied volatility, Delta, expiration, or unusual activity. Traders then confirm the setup against the underlying’s price action and apply predefined risk-management rules before entering.

How do I find high-probability options trades with a scanner?

Start by defining your strategy and scanning only for conditions that support it. Filter for liquidity, volume, open interest, expiration, and relevant Greeks, then confirm the underlying with price action, VWAP, support and resistance, and volume. Select the contract and define your maximum risk before entering.

What should I scan for when trading SPY and QQQ options?

Volume expansion, unusual options activity, liquidity, implied volatility, Delta, expiration, and technical conditions. Since SPY and QQQ have different underlying exposures, it also helps to weigh broad-market conditions for SPY and Nasdaq-100 or technology-sector momentum for QQQ.

Can an options scanner predict winning trades?

No. A scanner identifies contracts or conditions that meet specific criteria, but options prices are affected by the underlying’s movement, time, implied volatility, and other factors a scanner can’t forecast. It should be used as a filtering and idea-generation tool, not a prediction system.

What is the best way to use an options scanner?

Treat it as the first step in a repeatable process: scan, filter, confirm, select, manage risk. Start with the underlying market, use the scanner to narrow candidates, confirm the setup with technical analysis, choose an appropriate contract, and define the invalidation point before entry.
 

Categories
Finance Options Trading

How to Use Unusual Options Activity for Better Trades

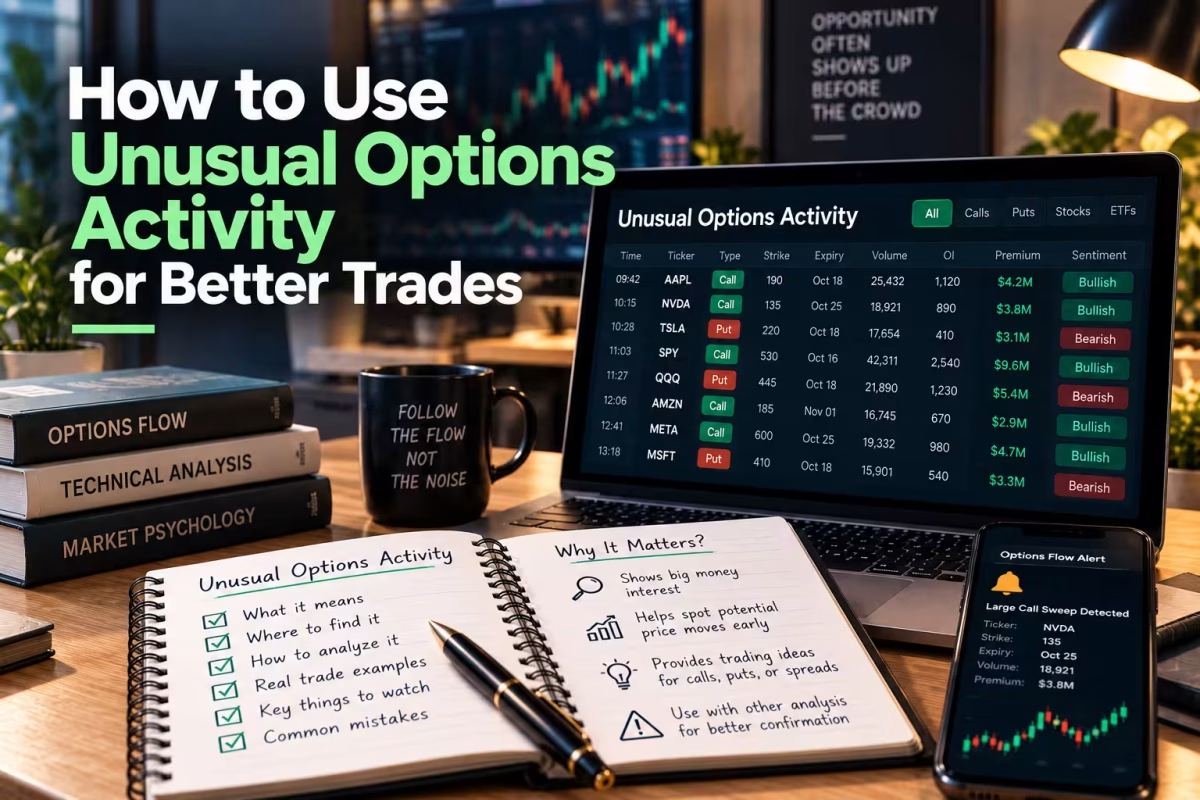
If you trade options on SPY or QQQ, you’ve probably seen a flow alert flash across your screen — a block of calls three times the average volume, or a sweep that looks too aggressive to ignore. The instinct is to treat it as a tip. It isn’t one.

Unusual options activity (UOA) is a genuinely useful signal, but it’s a research signal, not a trade signal. A large call or put print doesn’t tell you whether a trader is bullish or bearish, and it certainly doesn’t guarantee where price goes next. The real edge comes from combining that flow with the options chain, price action, implied volatility, and a few technical levels — then deciding whether the setup is actually worth the risk.

Quick answer: Unusual options activity flags where attention is building in the options market. It doesn’t tell you why it’s building or whether the trade will work. Treat it as a starting point for research, confirm it against price action, and only then build a risk-defined trade around it.

What Counts as “Unusual,” Exactly?

There’s no exchange-mandated threshold for unusual options activity — no regulator hands out a rulebook that says “5,000 contracts = noteworthy.” Scanners build their own definitions using volume relative to open interest, historical volume, premium size, and how aggressively the order was executed.

That’s why context matters more than the raw number. A 5,000-contract trade can be extraordinary in one name and routine in another. A few quick comparisons:

  • High volume paired with low historical activity → worth a second look
  • High volume in an already hyper-liquid SPY strike → often just noise
  • A large call trade against a falling underlying → needs investigating before you assume anything bullish
  • A large put trade during a rally → could easily be a hedge, not a bearish bet
  • High volume with unchanged open interest → not proof anyone opened a new position

Volume vs. open interest, briefly: volume is contracts traded today. Open interest is contracts still outstanding after the prior session’s clearing. High volume relative to OI tells you a contract is unusually active — it does not tell you that every one of those contracts represents a fresh directional bet. Confusing the two is probably the single most common mistake in flow analysis.

A Four-Step Framework: Signal → Context → Confirmation → Risk

1. Signal — what actually looks unusual?

Start with the raw mechanics: contract volume, the volume/OI relationship, estimated premium, strike, expiration, whether it printed as a sweep or a block, and where it executed relative to the bid/ask. One large print is interesting. Several related prints — same strike, similar timing, growing size — are more informative, because they hint at concentration and persistence rather than a single one-off order.

2. Context — why might this trade exist?

Before you assign a direction to anything, check what’s actually happening around it: the economic calendar, upcoming earnings, Fed announcements, CPI or jobs data, sector strength, and where SPY or QQQ sit relative to known support and resistance. Skipping this step is how traders end up reading a hedge as a bearish bet, or a rolled position as a brand-new one.

3. Confirmation — does price agree with the flow?

Say you spot heavy call buying in QQQ. On its own, that’s not a trade. Ask whether QQQ is actually holding above VWAP, whether it’s printing higher highs on expanding volume, whether RSI is confirming momentum rather than flashing exhaustion, and whether MACD supports the move. The same logic runs in reverse for puts. Flow without price confirmation is a lead, not a thesis.

4. Risk — where does the idea get proven wrong?

Before you enter anything, define your maximum dollar risk, position size, entry, stop-loss or technical invalidation level, profit target, and a time limit. This is the step that turns an interesting alert into an actual trading plan instead of a hunch with a ticker attached.

The Five UOA Signals Worth Watching Most

  1. Volume relative to open interest. A contract trading several multiples of its displayed open interest deserves a closer look — but a high volume/OI ratio alone doesn’t prove new buying. It could just as easily be closing activity, a roll, or one leg of a spread.
Metric Observation
Open interest 2,000
Session volume 12,000
Volume/OI 6×
Expiration 14 days
Strike Slightly OTM

That’s a real spike. It still doesn’t tell you whether it’s buying, selling, or something structural like a roll.

  1. Sweep orders. A sweep — an order routed aggressively across multiple exchanges to grab available liquidity — is a genuine urgency signal. It’s a timing clue, not proof that the trader behind it knows something you don’t.
  2. Block trades. A large block at the ask can look bullish on the surface, but it might be a hedge, one leg of a spread, a closing trade, a roll, or a fresh directional bet. “Block” and “institutional bullish conviction” are not the same thing, however often they get treated that way.
  3. Premium concentration. Estimated premium tells you where dollars are concentrated — it’s not the same as confirmed directional capital. A large headline premium can just as easily come from high volume, an expensive option, or both.
  4. Expiration and strike concentration. When activity clusters around one expiration and a handful of nearby strikes, it often signals a time-sensitive thesis. For SPY, that usually means watching macro catalysts and broad index levels. For QQQ, technology-sector leadership and mega-cap earnings tend to matter more.

SPY vs. QQQ: Why the Same Signal Means Different Things

SPY tracks the S&P 500 — broad, large-cap, heavily influenced by macro and rate expectations. QQQ tracks the Nasdaq-100 — more concentrated, more tech-and-growth-driven, and typically more reactive to individual mega-cap earnings.

Factor SPY Options QQQ Options
Underlying exposure Broad U.S. large-cap market Nasdaq-100
Main context Macro, rates, CPI, Fed policy Tech leadership, growth, mega-cap earnings
Useful confirmation Trend, VWAP, breadth, major levels Momentum, tech leadership, major levels
Typical UOA interpretation Often tied to hedging or index positioning Reacts sharply to sector catalysts
Key risk Macro reversals, volatility shifts Fast momentum reversals

Unusual put activity in SPY is frequently portfolio hedging rather than a directional bet. A large QQQ position built around a known tech catalyst usually has a more obvious event-driven explanation. Either way, the lesson is the same: calls and puts don’t carry a fixed meaning. Context decides that.

A Repeatable Process You Can Run Every Session

Step 1 — Start with the underlying, not the flow. Look at SPY or QQQ first: trend, support/resistance, VWAP, moving averages, volume, RSI, MACD, and any major catalyst on the calendar.

Step 2 — Find what’s actually unusual. Filter for volume, volume/OI, premium size, sweeps, blocks, repeated prints, and strike or expiration concentration.

Step 3 — Ask if the flow has a plausible explanation. Directional speculation, hedging, earnings positioning, volatility trading, spread construction, a roll, or simple profit-taking can all produce the same-looking print. If you can’t land on a reasonable explanation, don’t force one.

Step 4 — Check the flow against price.

UOA Price Action Interpretation
Bullish-looking calls Bullish breakout Stronger confirmation
Bullish-looking calls Price below resistance Wait for confirmation
Heavy puts Bearish breakdown Stronger confirmation
Heavy puts Price rising Investigate possible hedge
Calls and puts both elevated Choppy market Possibly volatility/spread activity
Huge volume, no price response — No confirmation — treat cautiously

Step 5 — Build the trade around risk, not around the flow print itself. You don’t need to copy the exact contract that showed up on the scanner. A different strike, expiration, or a defined-risk spread may fit your actual thesis better — and your risk-to-reward should be decided before you’re in the trade, not after.

Mistakes That Quietly Wreck a UOA-Based Process

It’s easy to assume every call is bullish, but calls get sold, hedged, and folded into spreads constantly. The reverse mistake is just as common: a fund holding a large equity position will often buy puts purely for protection, not because it’s turned bearish.

Volume and open interest also get conflated more than they should. They’re different measurements, and high volume alone doesn’t tell you who opened or closed a position. There’s also a timing trap — by the time a large trade becomes visible on a scanner, its premium may have already moved meaningfully, so chasing the exact contract often means chasing a worse price than the original trader got.

Implied volatility is another blind spot. Even if the underlying moves the way you expected, falling IV can still erode the option’s value and eat into — or erase — the gain. And oversized position sizing turns leverage from a tool into a liability: the SEC has been explicit that option buyers can lose their entire premium, and some option-writing strategies carry risk well beyond that. The most important reminder ties all of this together — unusual doesn’t mean correct. UOA tells you something unusual happened. It says nothing about whether the trader behind it will be proven right.

The 10-Point UOA Checklist

Before acting on any unusual options activity alert, run through this:

  1. Is the underlying trending?
  2. Is the activity genuinely unusual for that specific contract?
  3. How large is volume relative to open interest?
  4. Is the activity concentrated in one strike or expiration?
  5. Does the execution suggest urgency (sweep vs. routine order)?
  6. Could this be a hedge or part of a spread?
  7. Is there a known catalyst behind it?
  8. Does price action confirm the apparent direction?
  9. Is implied volatility reasonable for this setup?
  10. Where does the trade get invalidated, and how much are you willing to lose?

If more than a couple of these come back unclear, waiting is usually the better trade than forcing one.

Learn SPY and QQQ Options Trading with MySpyOptions

Reading options flow gets a lot easier once you actually understand the underlying market first — which is a big part of why structured education matters here. At MySpyOptions, the focus is specifically SPY and QQQ options: market structure, options chains, technical analysis, trade planning, and risk management, taught in live market conditions rather than through static, theoretical examples.

That distinction matters. Traders who learn to build and stress-test a live setup, rather than just receive an entry and exit, tend to develop judgment that holds up when the market doesn’t behave the way the textbook example did. What sets the approach apart:

  • SPY and QQQ specialization instead of a generic options curriculum
  • Practical education built around real trading conditions
  • Structured risk management and defined trade planning
  • Options-chain and price-action concepts that complement flow analysis
  • Trader support and mentorship for interpreting live setups as they happen

The goal isn’t to hand traders a signal to follow — it’s independence: understand the setup, weigh the evidence, manage the risk, and make the call yourself.

FAQs

What is unusual options activity?

Unusual options activity is trading that stands out from a contract’s normal behavior — through unusually high volume, an elevated volume-to-open-interest ratio, large premiums, sweep orders, block trades, or concentration around specific strikes and expirations. It flags contracts worth investigating; it doesn’t predict where price goes next.

How do you identify unusual options activity?

Look for volume that’s unusually high relative to open interest or the contract’s typical activity, along with large premiums, repeated sweeps, block trades, aggressive executions, or unusual concentration at certain strikes or expirations. Always weigh those signals against the underlying’s current price action and broader market conditions.

Is unusual options activity bullish or bearish?

It can be either, or neutral, depending on the trade. Heavy call activity can look bullish and heavy put activity can look bearish, but both can just as easily be sold, hedged, rolled, or built into spreads — which is why direction shouldn’t be assumed from calls or puts alone.

Can unusual options activity be used for SPY and QQQ trading?

Yes. It can help identify contracts, strikes, and expirations attracting extra attention. For SPY, weigh broad-market and macro conditions; for QQQ, Nasdaq-100 momentum and tech-sector catalysts add useful context. UOA is most useful when it confirms what price is already showing.

Is unusual options activity a reliable standalone trading signal?

It’s better treated as a research and confirmation tool than a standalone signal. A large trade can represent speculation, hedging, a roll, or spread construction. Pair UOA with price action, technical levels, implied volatility, known catalysts, and a defined risk plan before entering anything.


Categories
Finance Options Trading

Cash Secured Puts Explained for Beginners: How They Work, Benefits, and Risks!

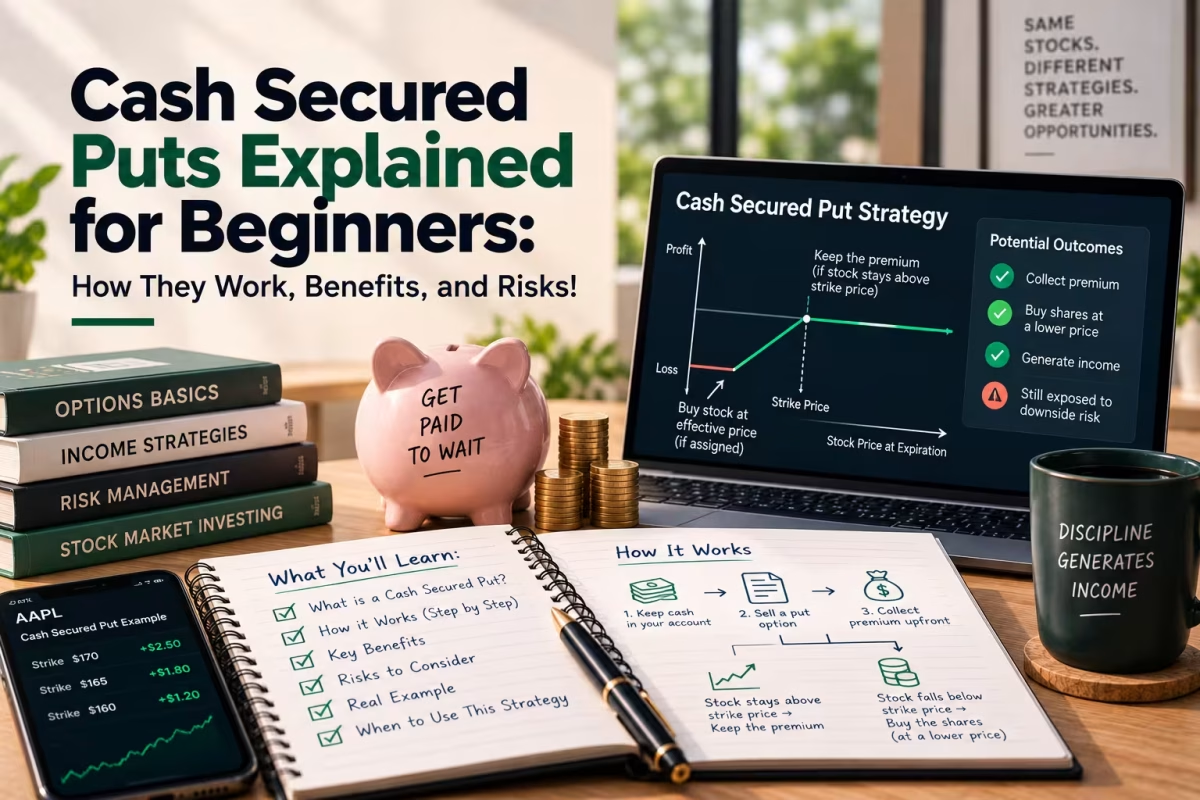
A cash-secured put is an options strategy that may assist investors in earning income from option premiums while seeking to buy the underlying stock at a preferred price. In this strategy, rather than buying the stock immediately, an investor writes put options and keeps some cash available for buying the shares in case of exercise of those options. This strategy may be beneficial for the investor when they are neutral to slightly bullish on a stock and are ready to own the stock at the chosen strike price. 

However, the premium received from writing puts doesn’t cover the downside risk if there is a drastic fall in the underlying stock. In this article, we’ll learn about the basics of cash secured puts and their profits and losses, their application, and risks for beginners. Read on for a detailed analysis!

What are Cash Secured Puts?

A cash-secured put is the sale of a put option accompanied by the maintenance of the required amount of cash in the broker’s account for the purchase of the underlying shares in case the option is assigned. The premium is earned in return for the acceptance of the obligation to buy the stock at the previously agreed strike price.

The typical size of the standard equity options contract is equal to 100 shares, even though the details of the contract may differ across the markets and underlyings. So, in case the investor sells a put with a $50 strike price, then the necessary cash for 100 shares will be $5,000. The received premium will lower the cost of the purchase of the stock.

The term “cash-secured” stands for the money set aside for the potential purchase of the stock. Unlike a naked put, a cash-secured put is backed by sufficient cash rather than relying on margin to meet the potential purchase obligation.

How Do Cash Secured Puts Work?

The process starts with choosing a stock that the investor would want to buy. The investor does not buy this stock at the prevailing market price but sells a put option at a chosen strike price that represents their desired entry price.

There are two outcomes in this situation:

  • The stock is above the strike price: The put may expire without value, therefore allowing the investor to receive the whole premium without owning any stock.
  • The stock is below the strike price: The put will be assigned, and the investor will be obligated to purchase the stock at the strike price as per the conditions of the contract.

The premium provides partial protection against the fall of the price. The cost basis after the assignment is usually estimated as follows:

Effective Cost Basis = Strike Price – Premium Received

So, in the case of the sale of a $50 put with the $2 premium, the cost basis is equal to $48 per share.

Cash-Secured Put Example

Assume that the stock is trading at $85, and an investor wishes to buy the stock at $80. The investor sells one put contract with an $80 strike and gets a premium of $2 per share, or $200 in total for 100 shares.

The investor will keep $8,000 as cash for buying the shares if they fall below $80.

In case the stock is at $82 at expiration, then the put would remain out of the money and would expire without any value. The investor keeps the premium of $200 and doesn’t buy any shares.

If the stock falls to $70, the put will be assigned and the investor can buy 100 shares at the $80 strike price. After accounting for the $200 premium, the effective cost basis will be $78 per share. This shows that the cost basis remains $78 even when the stock falls significantly below the strike price.

This worked cash secured put example shows that the premium lowers the effective purchase cost but does not protect the investor from losses if the stock continues to decline.

Maximum Profit and Break-Even Price

The maximum profit for cash secured puts is equal to the premium received.

Maximum Profit = Premium Received × Number of Shares

For one contract with a premium of $2, the maximum profit is $200.

The break-even price is:

Break-Even Price = Strike Price − Premium Received

With an $80 strike price and $2 premium, the break-even price is $78. Above $78, the position can be profitable at expiration, while below $78, the position results in a loss if the put is assigned. If the stock remains above the $80 strike price, the put may expire worthless and the investor keeps the full $200 premium.

But here the risk is that if the stock price goes to zero, the maximum loss, which is calculated as Maximum Loss = (Strike Price − Premium) × Number of Shares, will be ($80 − $2) × 100 = $7,800, not including the transaction cost.

The following summary shows the key figures from the $80 strike and $2 premium example:

Strike Price Premium Cash Required Break-Even Max Profit Max Loss
$80 $2/share ($200 total) $8,000 $78 $200 $7,800

A cash secured put calculator can use these same inputs to estimate the cash requirement, break-even price, maximum profit, and maximum potential loss for a trade.

Why Do Investors Use Cash-Secured Puts?

One of the reasons investors use cash secured puts is because of the possibility of premium income with the desired entry price for the stock. Rather than just placing a limit order and waiting for execution, the investor gets premium income in return for taking on the obligation of buying the shares at the selected strike price.

The strategy can serve several objectives:

  • To get premium income: The seller receives the premium for opening the position.
  • To target a lower price for entry: The investor selects a strike price below the stock’s current market price. 
  • To reduce the effective entry cost: If the put is assigned, the premium received lowers the net cost of acquiring the shares. 
  • To put cash to good use: The capital kept aside for future stock purchase generates option premium while the position remains open.
  • To maintain a neutral to moderately bullish outlook: The seller expects the stock to remain at or above the strike price through expiration.

How to Trade Cash-Secured Puts

Trading cash secured puts involves selecting the stock, strike price, expiry, and premium and keeping sufficient cash for the assignment of shares. The following are the key steps to trade cash-secured puts:

1. Choose the Underlying Stock

Choose the stock that you have studied and are comfortable trading with even if the market goes against you. Quality, valuation, liquidity, and implied volatility may affect the choice of the stock.

2. Choose the Strike Price

The strike price should reflect how much you are willing to buy the stock at. Out-of-the-money puts are used mostly in such cases.

3. Sell Put to Open

Sell the put option while having enough cash to cover your assignment obligation. The premium is credited to the account by the broker.

4. Managing or Exiting Position

If the stock stays above the strike price, the option can expire without any action. You can also buy the put option to close your position before the expiration date. If the option is assigned, the investor purchases the shares at the strike price and then manages the resulting stock position

Some traders choose to close or adjust their positions before the expiration date after capturing most of the available premium, however, the actual approach may vary based on your trade and risk management strategy.

Risks Associated with Cash-Secured Puts

Though the reserve of cash adds some structure to the trade, cash secured puts are not risk-free trades. Here are some possible risks of this strategy:

  • Stock decline: The investor can receive stocks after the assignment, which will be worth much less than the strike price.
  • Limited profit: The maximum profit is limited to the premium, and the stock increase does not add any extra profit.
  • Capital lockup: Money needed for the potential assignment can’t be freely used to enter new positions until you close or change the existing one.
  • Opportunity loss: In case of a significant stock increase without reaching the strike, the investor earns the premium but misses the opportunity to get the shares at a lower price.
  • Fundamental deterioration: A stock that looked attractive when the put was sold may later face weaker earnings, business problems, or changing market conditions.

Conclusion

Cash secured puts can offer a way to collect premiums and target the desired price for buying stocks. However, this strategy works well only for those who have enough cash and are ready to own the underlying stock in case of its price fall. The collected premium can reduce the effective cost, but the strategy can still result in significant losses because of falling prices. 

To turn options concepts into practical market understanding, explore MySPYOptions for actionable education, market perspectives, and trading insights that can support more informed options decisions.

FAQs

1. What are cash secured puts?

Cash-secured puts are the strategy of selling a put option while having enough cash to buy the stock if there is an assignment and the investor wants to get the stock at the desired price.

2. How much money is needed for cash-secured puts?

Generally, the cash needed for the put is equal to the amount of money for purchasing the stock at the strike price, usually 100 shares for one equity option contract, so the premium for the strike price of $50 will be around $5,000.

3. What is the maximum profit from cash-secured puts?

The maximum profit from cash secured puts is limited by the premium received when the option was sold and is earned if the option expires without assignment or if the investor closes the position and makes money before then.

4. What happens if the cash-secured put expires in the money?

The investor receives an assignment of the put option and buys the shares at the strike price using the money reserved for the assignment.

5. Are cash-secured puts risky?

Yes, cash secured puts can involve substantial losses if the underlying stock declines significantly below the strike price, although the premium received provides a limited cushion by reducing the effective cost of the shares.


Categories
Finance Options Trading

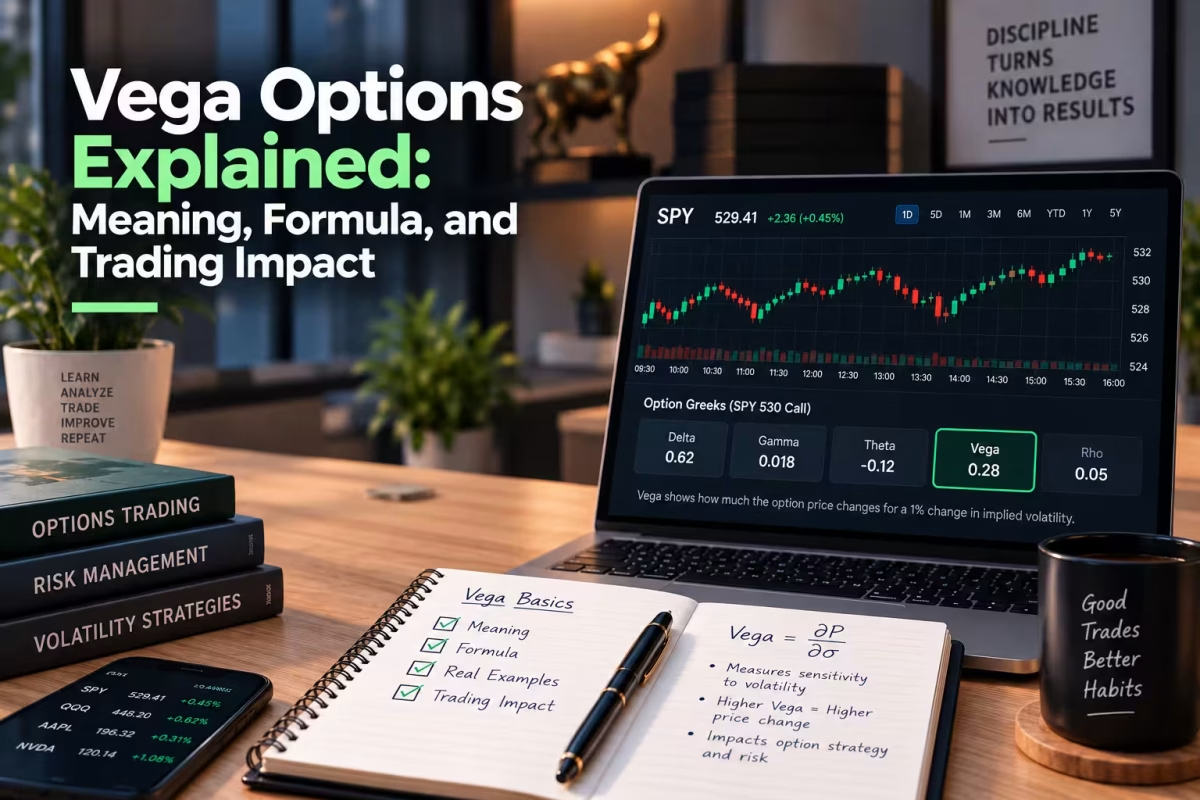
Vega Options Explained: Meaning, Formula, and Trading Impact

Vega options measure how sensitive an option’s premium is to shifts in implied volatility. An option’s price can change even when the underlying asset barely moves. The main driver behind that kind of move is implied volatility, the market’s forward-looking estimate of how much an asset’s price could swing. Vega is used to calculate how sensitive the option price is to a change in volatility. Understanding vega options helps traders weigh volatility risk before opening a position, rather than after. 

In this article, we will explain what vega options are, their formula, practical applications, and common trading mistakes to avoid. Read on for a detailed analysis!

What is Vega in Options?

Vega is an option Greek that measures the sensitivity of an option premium to the change in implied volatility. In simple terms: Vega tells you how much an option’s price is expected to move for every 1 percentage-point change in implied volatility, all else held equal. 

If Vega equals $0.60, this means that the option premium is expected to grow (decline) by approximately $0.60 if the implied volatility grew (declined) by 1 percentage point. Vega is applicable to both calls and puts, though its effect depends on the type of position opened. Vega is usually higher for at-the-money options and longer-dated options.

How Does Vega Impact Option Prices?

Implied volatility directly impacts the extrinsic value of an option. When there is an expected increase in volatility, premiums are likely to rise, while a decrease in volatility may lower premiums.

Long call and put options usually have positive Vega, meaning increased volatility is beneficial for them. Short options, on the other hand, normally have negative Vega, meaning they react negatively to increased volatility. Longer-dated options are more sensitive to volatility shifts than shorter-dated ones.

Vega does not measure volatility itself; it measures sensitivity to it.

Vega Options Formula (How to Calculate Vega)

The standard Black-Scholes model offers a mathematical approach to calculating Vega. The formula is:

Vega = S × φ(d₁) × √T

Where:

  •       S is the price of the underlying asset
  •       φ(d₁) is the standard normal probability density function at the point d₁
  •       T is the time remaining until the option’s maturity, in years
  •       d₁ is a function of the underlying asset price, strike price, volatility, interest rate, and time to expiration

This equation estimates the impact of implied volatility changes on an option’s theoretical value. Since market quotes are given in percentages, traders typically interpret Vega relative to a 1% change in implied volatility.

The precise calculation depends on the pricing model and contract specifications, so traders generally rely on the Vega figure provided by their trading platform rather than calculating it manually for every position.

Vega Options Example

An example helps clarify the concept. Assume a call option costs $12, with implied volatility of 20% and a Vega of $0.80.

If implied volatility rises from 20% to 21%, the estimated premium change would be:

$0.80 × 1 = $0.80

In this case, the option premium would move from $12 to $12.80, assuming all other factors stay constant.

Conversely, if implied volatility falls from 20% to 19%, the estimated premium would drop to $11.20.

This is an estimate, not a guarantee. The price of the underlying asset, time value, interest rates, and other Greeks can shift simultaneously, so the actual premium move will likely differ from what Vega alone suggests.

How Traders Can Use Vega

Vega gives traders a way to assess how sensitive their options position is to changes in implied volatility. It can help in choosing better contracts and building appropriate trade plans. Common uses include:

Assessing Volatility Exposure

This shows whether a position has positive or negative exposure to implied volatility. A positive-Vega position benefits from rising implied volatility, while a negative-Vega position can benefit from falling implied volatility.

Comparing Option Contracts

Traders can compare Vega across strikes and expiration dates to identify contracts with higher or lower volatility sensitivity.

Evaluating Volatility-Based Strategies

Traders anticipating changes in implied volatility can use Vega to gauge premium sensitivity — useful for volatility-focused strategies that don’t depend on price direction.

Managing Multi-Leg Positions

Vega can be summed across individual legs to evaluate the volatility exposure of a multi-leg strategy. For example, a position with +0.50 Vega combined with one at -0.30 Vega nets to approximately +0.20 Vega.

Monitoring Portfolio Risk

Tracking total portfolio Vega helps traders understand how the whole book reacts to volatility shifts. A portfolio with high positive or negative Vega can see substantial value changes when implied volatility moves.

Relationship Between Vega and Options Strategies

The table below shows the relationship between Vega and common options strategies:

Options Strategy Typical Vega Exposure Impact of Rising Implied Volatility
Long Call Positive Generally beneficial
Long Put Positive Generally beneficial
Short Call Negative Generally unfavorable
Short Put Negative Generally unfavorable
Long Straddle Strong Positive Generally beneficial
Long Strangle Positive Generally beneficial
Short Straddle Strong Negative Generally unfavorable
Short Strangle Negative Generally unfavorable


Actual Vega exposure will vary depending on strikes, expirations, and other contract characteristics.

Mistakes to Avoid When Trading Vega Options

Vega offers valuable information, but it shouldn’t be analyzed in isolation. Traders often misjudge an option’s risk by focusing on a single Greek while ignoring the broader pricing picture. Common mistakes include:

  •       Confusing Vega with volatility: Vega indicates sensitivity to implied volatility — it isn’t the volatility figure itself.
  •       Ignoring the underlying price: An option’s premium can shift from implied volatility alone, even if the underlying asset isn’t moving.
  •       Treating Vega as a guarantee: Vega assumes every other input stays constant, which rarely holds true in live markets.
  •       Overlooking portfolio-level Vega: Individual positions may show small Vega values, but combined across a portfolio, the exposure can become significant.

Delta, Gamma, Theta, implied volatility, and underlying price should all be considered alongside Vega, not in place of it.

Conclusion

Vega shows how changes in implied volatility can affect option prices. Its significance grows with time to expiration and with higher sensitivity to volatility shifts. Analyzing the Vega of each trade and strategy can help surface potential risks, but vega options analysis should be one part of a broader options analysis, not a standalone signal.

If you want to sharpen your options knowledge with actionable insights, market perspective, and educational resources, visit MySPYOptions for options trading education and market insight.

FAQs

  1. What is Vega in options?

Vega shows how much an option’s premium may change for every 1 percentage-point move in implied volatility, assuming other factors stay constant. The higher the Vega, the more sensitive the option is to implied volatility changes.

  1. Is higher Vega good for options traders?

Not always. High Vega can benefit traders holding long option positions when implied volatility rises, but it can also raise risk if implied volatility falls. It depends on the trader’s position and outlook.

  1. Is Vega positive for calls and puts?

Yes, Vega is positive for both long call and long put positions. Their premiums rise with increasing implied volatility and fall as implied volatility declines.

  1. What happens to Vega when implied volatility rises?

Premiums on long options tend to increase. However, Vega itself can shift with market conditions, moneyness, and time to expiration, so it shouldn’t be treated as a fixed number.

  1. Which options have the highest Vega?

At-the-money options typically carry the highest Vega. Longer-dated options also tend to have higher Vega, since there’s more time for volatility changes to affect the premium.

  1. What’s the difference between Vega and Delta?

Delta measures sensitivity to the underlying asset’s price movement, while Vega measures sensitivity to implied volatility changes. Together, they help traders assess different dimensions of options risk.


Categories
Finance Options Trading

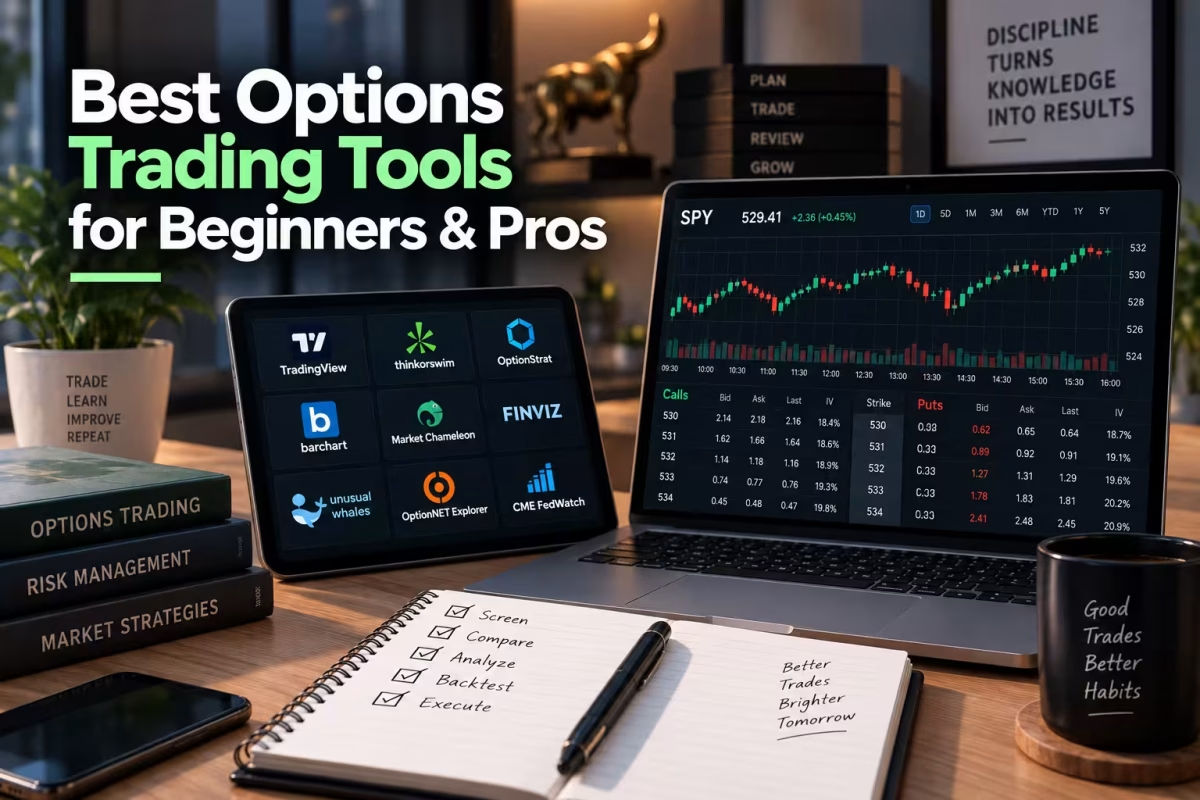
Best Options Trading Tools for Beginners & Pros

The right options trading tools depend less on your experience level and more on which job you’re trying to do — placing trades, finding candidates, sizing risk, or reviewing what worked. Most “best tools” roundups mix brokers, screeners, and calculators into one undifferentiated list, which leaves beginners overwhelmed and pros without a clear upgrade path.

This guide organizes options trading tools by the actual job they solve, gives you a decision matrix for building a stack that matches your experience level, and shows what a minimal, practical toolkit looks like if your focus is SPY and QQQ rather than the entire market.

What Counts as an Options Trading Tool?

In short: An options trading tool is any software that helps you find, analyze, size, execute, or review an options trade. That spans five distinct jobs — execution, discovery, analysis, risk sizing, and review — and no single platform does all five equally well.

Most traders start with just a broker’s built-in platform and gradually add specialized tools as their strategies get more specific. The mistake isn’t using a broker platform alone; it’s assuming that one tool covers every job in the process.

The 5 Categories of Options Trading Tools You Actually Need

Bottom line: Every options trading tool on the market fits into one of five jobs — execution, discovery, analysis, risk management, or performance review. Knowing which job a tool solves prevents you from paying for overlapping features or missing a category entirely.

Category Job It Solves Common Examples
Execution platforms Placing and managing trades thinkorswim, tastytrade, Interactive Brokers, Fidelity
Discovery tools (screeners/scanners) Finding contracts or setups matching your criteria Broker-built screeners, Barchart, dedicated flow scanners
Analysis tools Modeling payoff diagrams, Greeks, and probability OptionStrat, platform-native P/L visualizers
Risk & position sizing tools Calculating position size, Stop-Loss levels, and Risk-to-Reward Ratio Broker margin calculators, spreadsheet models
Performance review tools Journaling trades and analyzing what worked Trade journal software, broker trade history exports

Key takeaway: A complete toolkit touches all five categories. Most beginners over-invest in execution platform features (chasing the “best broker”) while skipping performance review entirely — and review is often what separates a trader who improves from one who repeats the same mistakes for years.

Building Your Tool Stack: A Decision Matrix by Experience Level

Rather than adopting every tool a “best of 2026” list recommends, match your stack to your actual stage. Adding pro-level complexity too early usually slows a beginner down; staying with beginner tools too long caps a pro’s edge.

Stage Execution Discovery Analysis Risk Sizing Review
Beginner Broker’s standard platform with paper trading Broker’s built-in screener only Broker’s native payoff diagram tool Simple percentage-of-account rule Manual notes after each trade
Intermediate Broker platform + real-time Greeks Broker screener + one dedicated free tool (e.g., Barchart) Dedicated payoff visualizer (e.g., OptionStrat) Spreadsheet-based position sizing model Basic trade journal software
Pro / Active Platform with advanced order types and multi-leg execution Real-time flow scanner + custom saved screens Multi-leg strategy builder with IV Rank overlays Automated risk dashboards, portfolio-level Greeks Structured journal with tagged strategy performance

In short: Progression through this matrix should follow your strategy complexity, not your account size. A trader running the same covered call strategy for three years doesn’t need pro-tier discovery tools just because their account has grown — but a beginner running multi-leg iron condors from day one is already under-tooled with beginner-stage discovery alone.

Comparing Popular Options Trading Tools by Category

Here’s how well-known tools map onto the five categories above. This isn’t a ranked “best overall” list — the right fit depends on your stage and strategy, not a single winner.

  • thinkorswim (Schwab) — Execution and analysis. Strong native Option Hacker screener, paper trading, and a deep glossary linked directly to live metrics like Implied Volatility and the options Greeks.
  • tastytrade — Execution and discovery. Built around options-first workflows with an integrated screener and embedded educational context on the trade ticket itself.
  • Interactive Brokers — Execution for advanced traders. Offers a Probability Lab and Volatility Lab for traders who need institutional-grade analytics alongside global market access.
  • Barchart — Discovery. A free, web-based screener useful for beginners learning which filters (Open Interest, Volume, Implied Volatility) matter before committing to a paid tool.
  • OptionStrat — Analysis. Purpose-built for visualizing payoff diagrams and probability of profit across single- and multi-leg strategies before risking capital.
  • Dedicated flow/scanner platforms — Discovery, for pros specifically watching unusual options activity as a directional signal rather than filtering by fixed criteria.

Bottom line: No single platform excels at all five jobs. Most experienced traders run two or three tools together — one for execution, one for discovery, and a lightweight review process — rather than searching for one app that does everything.

A Minimal SPY & QQQ Tool Stack

Most tool roundups are built for traders scanning the entire market across thousands of tickers. If your focus is exclusively SPY and QQQ, a much smaller stack does the job — and paying for whole-market breadth is often wasted spend.

Practical workflow for a SPY/QQQ-focused trader:

  1. Execution: A broker with real-time Greeks and paper trading for practice (thinkorswim or tastytrade both work well here).
  2. Discovery: A single saved screen per ticker, since the Invesco QQQ Trust (QQQ) and SPDR S&P 500 ETF Trust (SPY) carry different baseline Implied Volatility profiles and shouldn’t share one filter set.
  3. Analysis: A payoff visualizer to confirm max loss, max gain, and breakeven before entering any multi-leg position.
  4. Risk sizing: A simple rule — for example, capping any single position at 1-2% of account value — checked against your calculated Risk-to-Reward Ratio.
  5. Review: A basic log of entry criteria, exit reason, and outcome, reviewed weekly rather than after every single trade.

Mini example (hypothetical, for illustration only): A trader running weekly SPY put credit spreads doesn’t need a $100/month flow scanner tracking dark pool activity across the whole market. A broker’s built-in screener, one saved filter (30-45 DTE, 0.20-0.25 delta, IV Rank above 40), a free payoff calculator, and a simple spreadsheet journal cover the entire workflow at little to no added cost.

Common Mistakes When Building an Options Trading Toolkit

  1. Chasing the “best broker” instead of the right job fit. A broker with the deepest analytics is wasted on a trader who only needs basic execution and a simple screener.
  2. Skipping performance review entirely. Execution, discovery, and analysis tools get attention; almost nobody journals consistently, even though it’s often the highest-leverage habit for improvement.
  3. Scaling tool complexity with account size instead of strategy complexity. A bigger account doesn’t require pro-tier tools if the strategy hasn’t changed.
  4. Using one filter set for both SPY and QQQ. Their different volatility baselines mean a single IV threshold will misclassify one of the two.
  5. Treating a tool’s output as a finished decision. Any screener result, payoff diagram, or flow alert still needs a check against the underlying’s technical chart, Moving Averages, MACD, or VWAP before you act.

Learn to Use These Tools with Purpose: MySpyOptions

Tools organize information — they don’t teach judgment. Knowing that a broker’s screener returned a 0.20-delta SPY put, or that a payoff calculator shows a favorable Risk-to-Reward Ratio, only matters if you understand how that trade fits your broader plan and risk tolerance.

This is where MySpyOptions fits into the toolkit conversation. Rather than teaching generic options theory across every possible underlying, the platform focuses specifically on practical SPY and QQQ trading — the two most liquid, most heavily traded instruments for retail options traders — so the tools above connect directly to strategies you’ve actually studied rather than abstract examples. Structured, strategy-specific education tends to build consistency faster than assembling tools without a framework for using them.

Why Choose MySpyOptions

Buying more tools rarely fixes inconsistent trading. MySpyOptions is built around three things that actually move the needle:

  • Focused curriculum on SPY and QQQ, so lessons map directly to the minimal tool stack most retail traders actually need.
  • Practical strategy walkthroughs that connect screener output, payoff diagrams, and position sizing into one coherent process instead of disconnected tools.
  • Trader support from experienced traders and a community reviewing the same setups — without exaggerated promises about tools or performance.

The goal is turning a pile of tools into a repeatable process.

Key Takeaways

  • Options trading tools fall into five jobs: execution, discovery, analysis, risk sizing, and review. A complete toolkit touches all five, not just execution.
  • Match tool complexity to your strategy’s complexity, not your account size or a generic “best of 2026” ranking.
  • No single platform does all five jobs well — most traders run two or three tools together.
  • If you only trade SPY and QQQ, a minimal five-step stack usually beats an expensive, whole-market platform.
  • Tools organize information; they don’t replace risk management, chart review, or a structured process for interpreting what they show you.

Frequently Asked Questions

What are the most important options trading tools for beginners? Beginners generally need just three things to start: a broker platform with paper trading, that broker’s built-in screener, and a simple risk-sizing rule like capping any position at 1-2% of account value. More advanced tools can wait until strategy complexity actually requires them.

Do I need a paid options trading platform, or is a free one enough? For most retail traders, a broker’s free, built-in tools (screener, payoff diagrams, paper trading) cover execution, discovery, and analysis. Paid, dedicated tools become worthwhile once your strategy specifically requires features your broker doesn’t offer, like real-time flow data or advanced portfolio-level Greeks.

What’s the difference between an options screener and a trading platform? A trading platform executes and manages trades; a screener filters the options chain by criteria like delta, implied volatility, and open interest to help you find candidates before you trade. Many platforms include a basic screener, but dedicated screening tools often add deeper filters.

Should I use the same tools for SPY and QQQ that I’d use for individual stocks? Not entirely. SPY and QQQ have different baseline Implied Volatility and are driven more by macro events than single-company earnings, so a screener calibrated for individual-stock earnings proximity is less useful here than one accounting for Federal Reserve announcements and broad market catalysts.

Why is trade journaling considered a trading tool? Because performance review is one of the five core jobs any complete toolkit needs to cover. Reviewing entry criteria, exit reasoning, and outcomes systematically is often what separates traders who improve over time from those who repeat the same mistakes.

Can I trade options successfully with just a broker’s built-in tools? Yes, for many strategies. A broker’s native screener, payoff visualizer, and paper trading account cover the essential execution, discovery, and analysis jobs. Dedicated third-party tools add depth but aren’t required to start trading responsibly.


Categories
Finance Options Trading

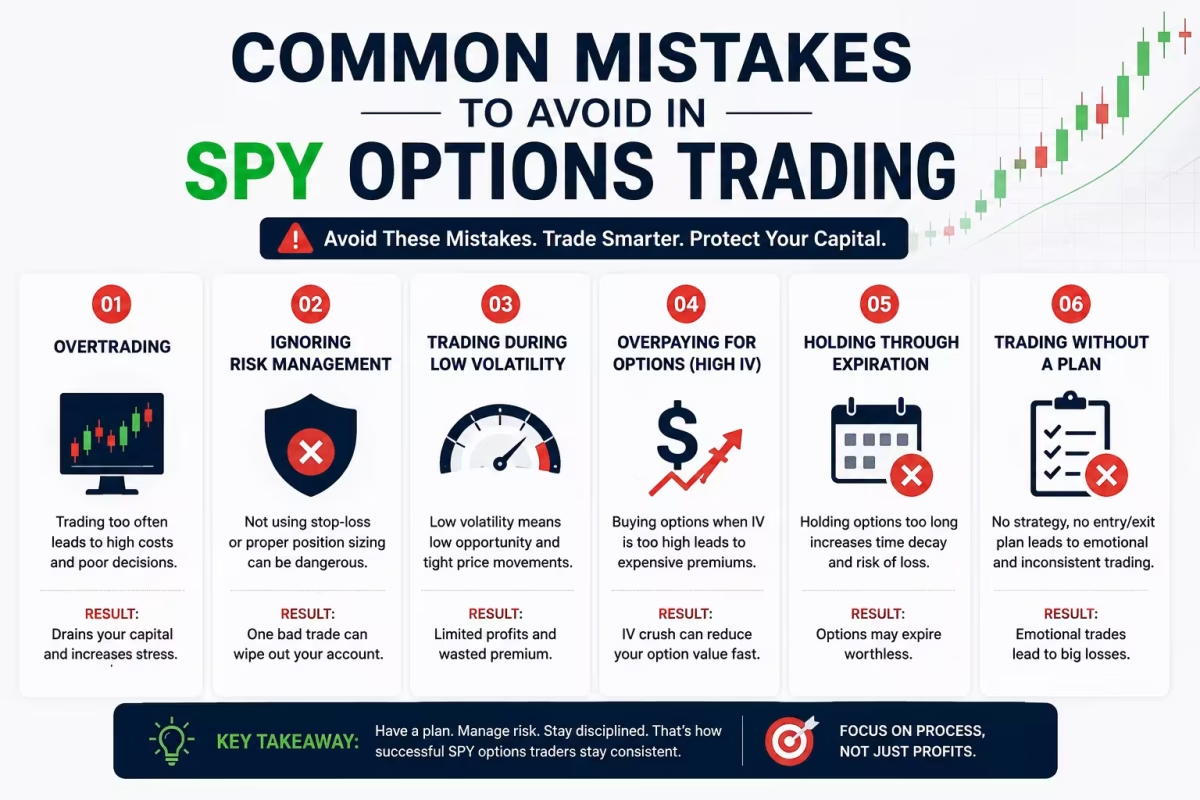
Common Mistakes to Avoid in SPY Options Trading

10 Common SPY Options Mistakes (And How to Fix Each One)

By Srinivas Ranga, Founder & Lead Trading Advisor, MySpyOptions  |  Updated July 2026

Trading options on SPY looks deceptively simple. It’s the most liquid ETF on the planet, it moves every single session, and options premiums are cheap enough for almost anyone with a brokerage account to jump in. But that accessibility is a double-edged sword — and it’s the exact reason so many retail traders end up blowing up accounts, even on days when their market bias was dead right.

Unlike buying plain stock, trading options means managing multiple moving parts at once. Time decay quietly chews away at your position, volatility spikes and collapses without warning, and sudden Gamma shifts can wipe out a morning’s gains in seconds.

Too many traders spend months searching for a secret technical indicator or buying expensive strategy courses. In reality, accounts rarely blow up because a chart setup was missing a line. They blow up because of repeatable execution errors.

Whether you’re scalping quick 2-minute momentum bursts (see our breakdown of options scalping strategies that actually work), playing intraday VWAP rejections, or swing trading 0DTEs, cutting out these ten mistakes will do far more for your bottom line than any new indicator ever could.

Key Takeaways: Common SPY Options Mistakes & Fixes

# Mistake The Core Problem What to Do Instead
1 Winging Trades Mid-trade emotional panic Write down your entry, stop, target, and sizing before opening bell.
2 Excessive Risk Fast account drawdowns Cap risk at a strict 1%–2% of total account capital per trade.
3 Chasing FOMO Buying extended tops/bottoms Wait for pullbacks to dynamic support like the 9 EMA or VWAP.
4 Buying Cheap OTMs Severe Theta decay, low Delta Stick to near-the-money (0.40–0.60 Delta) strikes with tight spreads.
5 Revenge Trading Compounding emotional losses Walk away from the screen the moment you hit your daily loss limit.
6 Ignoring Greeks Unseen IV crush & decay Always evaluate Delta, Theta, Gamma, and Vega before placing an order.
7 Trading Macro Data Volatility drops & wide spreads Sit in cash through CPI and Fed announcements until initial moves settle.
8 Isolated Patterns Trading against broader context Align 1-minute setups with key daily levels, VWAP, and market breadth.
9 No Trade Journal Repeating bad execution habits Keep a daily log of entries, exits, risk parameters, and emotions.
10 Strategy Hopping Abandoning statistical edge Commit to at least 100 executions before tweaking a system.


Why Is SPY Execution So Critical Right Now?

SPY isn’t just another popular ticker — it sits right at the center of the U.S. options ecosystem. According to Cboe’s Q2 2026 options industry report, SPY alone accounted for roughly 42% of all ETF options volume that quarter.

That means a massive chunk of retail options flow — and retail losses — runs through this single ticker. When a market this liquid still produces so many blown accounts, the issue isn’t a lack of opportunity or execution speed. It’s disciplined execution.

Why Do Good Market Reads Turn Into Losing Options Trades?

Most traders assume a red trade simply means they picked the wrong direction. But in options, directional accuracy is only half the battle — execution pays you.

Picture two traders watching the exact same chart at market open:

Trader A buys a liquid, near-the-money contract with a 1-cent spread, sets a firm stop below key support, and scales out as price hits resistance.

Trader B buys a cheap, far-out-of-the-money contract with poor volume, gets hit with IV crush the moment price stalls, and stubbornly holds on through a pullback until the premium dies.

Both had the exact same bullish thesis. One walked away with a profit; the other took a soul-crushing loss. The difference wasn’t the direction — it was contract selection, risk management, and emotional discipline.

The 10 Most Common SPY Options Mistakes

1. Flying Blind Without an Operational Plan

Buying calls or puts based on a “gut feeling,” a sudden green candle, or an alert on social media is the fastest way to donate your cash to market makers.

A real trading plan isn’t a vague idea floating around in your head. It’s a set of hard rules established before the bell rings:

  •     What exact setup triggers your entry?
  •     Where is your invalidation point (stop-loss)?
  •     Where is your target based on nearby support or resistance?
  •     How much cash are you risking relative to your total account balance?

If you jump into a trade without these parameters mapped out beforehand, every tick against you triggers fear, leading to impulse decisions that usually end in a loss.

2. Treating Risk Management as an Afterthought

Beginners spend almost all their energy thinking about how much money they could make, and virtually none thinking about how much they could lose. Experienced traders flip that math around.

If you risk 10% or 20% of your account on a single position, a quick three-trade losing streak leaves you in a deep hole. Remember: recovering from a 50% drawdown requires a 100% gain just to get back to even. By capping risk at 1% to 2% per trade, your account can comfortably absorb the normal, inevitable losing streaks that happen to every trader.

3. Chasing Vertical Moves (FOMO)

Watching SPY print three massive green candles on the 1-minute chart triggers an instant fear of missing out. You slam the market buy button, only to enter right at the exact high of the move — just as institutional traders start taking profits.

Instead of chasing extended moves, patient traders let the initial impulse happen and wait for price to come back to them. Look for pullbacks into the 9 EMA, retests of VWAP, or volume consolidation near key levels. You might miss a few runaway moves, but your win rate and risk-to-reward ratio on the trades you do take will jump significantly.

4. Buying “Cheap” Contracts Instead of Good Ones

A $0.15 out-of-the-money contract isn’t a bargain — it’s usually just money burned. Low-Delta options need SPY to make a violent, massive move just to move the needle, all while rapidly decaying to zero as the clock ticks down. Understanding how an option chain works makes it much easier to compare strikes and spot contracts that are actually worth paying for.

When selecting SPY options, prioritize contract quality over cheap premium:

  •     Liquidity & Spreads: Stick to active strikes with 1-cent to 2-cent bid-ask spreads so you aren’t losing 10% of your capital to slippage on entry.
  •     Delta: Choose near-the-money or slightly in-the-money contracts (0.40 to 0.60 Delta) so option premium moves reliably with SPY’s underlying price.
  •     Implied Volatility: Avoid buying options when IV is artificially spiked, as the post-event IV crush will deflate your contract even if SPY moves your way.
5. “Revenge Trading” to Get Back to Even

Taking a fast loss on a setup that should have worked creates an immediate urge to jump right back into the market and “make it back.”

That’s revenge trading, and it’s the quickest route to turning a minor drawdown into a devastating day. Trading out of frustration means you’re no longer following a setup — you’re gambling. You ignore VWAP, overlook wide spreads, and trade oversized positions out of spite.

The Fix: Accept that losses are simply an operational cost of trading. The moment you hit your daily risk limit, step away from the trading desk and close your platform. One disciplined decision to stop after a loss is worth far more than three impulsive trades trying to fix it.

6. Blindly Ignoring the Options Greeks

Trading options without tracking the Greeks is like driving fast without looking at your dashboard. You might stay on the road for a bit, but eventually, something breaks under the hood.

  •     Delta: Shows how much option price moves per $1.00 shift in SPY. Far out-of-the-money “lottery” contracts have low Delta, meaning they lag price action drastically.
  •     Theta: The steady drain on option premium. Theta accelerates rapidly during the final hours of the session. If SPY chops sideways, Theta bleeds your position dry.
  •     Gamma: Tracks how fast Delta changes as price moves. Gamma is a double-edged sword on 0DTE contracts: it can double your capital in minutes, but it can erase premium just as fast on a slight tick against you.
  •     Vega: Measures sensitivity to Implied Volatility. Buying options right before a major catalyst when IV is high leaves you vulnerable to a sharp IV crush once the news breaks.
7. Trading High-Impact Economic Data Drops

Federal Reserve rate announcements, CPI inflation reports, and Non-Farm Payrolls trigger massive price action in SPY. While those wild swings look tempting, buying options seconds before a major data release exposes you to severe slippage, erratic spreads, and immediate volatility crush.

A safer approach: check the economic calendar every morning. If a major Fed speech or inflation report is scheduled, stay on the sidelines until the initial reaction settles and price action builds a clean structure you can actually manage.

8. Trading Chart Patterns in a Vacuum

A textbook bullish breakout setup might look great on a 1-minute chart, but if SPY is slamming right into major daily resistance while market breadth collapses, that breakout is very likely to trap buyers.

Before taking a trade, step back and check the broader context:

  •     Is SPY trading above or below VWAP?
  •     Are major mega-cap tech stocks backing the move?
  •     Is the broader market trending cleanly or just chopping inside yesterday’s range?

A chart setup is only as reliable as the market conditions surrounding it.

9. Refusing to Keep a Trading Journal

Ask most struggling traders why they lost money on Tuesday, and they won’t have a clear answer. They remember their big green days clearly, but quickly brush off bad trades without reflecting on them.

If you don’t track your performance, you’re bound to repeat the same mistakes indefinitely. Keeping a simple journal where you log entries, exits, risk sizing, and emotional state highlights critical patterns over time — like realizing you make most of your profits before 11:00 AM and give them back during the afternoon lull.

10. “Strategy Hopping” After a Couple of Losses

The classic retail loop: learn a setup, take two losses, abandon it, try a new system, take three losses, and switch again. This shows up constantly with short-dated contracts — see our guide to trading weekly options for quick profits to learn how to test a framework structuredly instead of quitting after normal variance.

No strategy boasts a 100% win rate. Abandoning a setup every time you hit a rough patch prevents you from ever collecting the sample size needed to see if it actually works. Real consistency comes from choosing one sound approach and mastering its execution over hundreds of reps.

The PREP Framework: A Daily Operating Routine

To keep emotions from hijacking your trading, run this four-step process every session:

P — Prepare: Before market open, review overnight news, map key support and resistance levels on SPY, note scheduled catalysts, and set your daily loss limit.

R — Review: Before entering a trade, run through a quick mental checklist: Is SPY holding VWAP? Is volume expanding? Is the bid-ask spread tight?

E — Execute: Enter only when all criteria line up. Place hard stops and profit targets immediately, then let the trade work without micromanaging every single tick.

P — Post-Trade Audit: At the end of the day, log your executions, note any discipline errors, and track what performed well.

Mastering the Psychological Game

Charts and technical indicators can point out where price might head, but your mindset determines whether you actually keep the profit. Uncontrolled emotions show up instantly on a P&L statement — and usually in the exact same ways.

Trigger The Account Damage The Real-World Correction
Fear You cut winners early out of pure anxiety, leaving 70% of the move on the table. Set hard profit targets beforehand and scale out in pieces instead of dumping all at once.
Greed You watch a +40% trade round-trip back into a loss because you wanted a homerun. Respect key resistance levels on the chart and lock in gains as price gets there.
FOMO You market-buy extended green candles right at the high of the day. Train yourself to sit on your hands until price pulls back to the 9 EMA or VWAP.
Revenge You double your size right after a loss just to try and get back to green. Mandate an immediate 15-minute break away from your screens after taking a loss.
Overconfidence You size up way too big after three wins in a row, setting up a massive drawdown. Treat your sizing like a strict rulebook — keep it fixed regardless of recent wins.


Disciplined Execution vs. Trading on Impulse

Put a disciplined trader and an emotional trader in front of the exact same chart setup, and you’ll get two totally different account curves over six months.

A disciplined trader sticks to a defined playbook. They wait for price to come to their key levels, risk a set dollar amount, and hit the exit without arguing when a trade invalidates. A loss doesn’t ruin their day — it’s logged in their trading journal as an operational cost, and they move on. They aren’t trying to make a fortune on a random Tuesday morning; they’re building consistency over a sample size of hundreds of executions.

An emotional trader operates on raw feeling. They chase vertical candles after the move already happened, average down on losing calls to avoid taking a loss, and scale up their size frantically when frustrated. They evaluate their entire worth as a trader based on today’s account balance rather than execution quality. That habit almost always leads to a wiped-out account.

Breakdown of a Failed SPY Trade

Here is a classic setup that catches retail options traders off guard almost every single week.

SPY gaps up at the open on overnight news. Within the first 10 to 15 minutes, candles start ripping upward. Seeing the vertical move, a trader panics that they’re missing out and market-buys a cheap, far-out-of-the-money call right at the high of the morning — a classic trap we cover in our guide to choosing calls vs. puts.

Here’s how the trap springs:

  •     Institutional buyers who bought the gap-up start locking in profits, drying up buying momentum.
  •     SPY slowly drifts lower to retest VWAP.
  •     Opening bell volatility cools down, causing implied volatility (IV) to drop.

Even though SPY is still trading higher than yesterday’s close, the trader’s option contract sinks 30% to 40% in minutes due to time decay and IV crush. Panic sets in. They market-sell at the absolute bottom of the pullback for a heavy loss — just seconds before SPY bounces cleanly off VWAP and trends higher for the rest of the day.

Notice what happened here: the trader didn’t lose money because their macro view was wrong. They lost money because they chased an extended move, bought a low-Delta contract with inflated IV, and entered without an exit plan. A patient trader simply would have waited for the VWAP retest, checked for renewed buying volume, bought a liquid near-the-money contract, and set a tight stop right below support.

Your Pre-Trade Operational Filter

Before loading up an order and clicking buy, run through these four quick checkpoints:

  1. Macro Environment
  •     Is there a Fed speaker, CPI print, or major data release scheduled today?
  •     Is SPY trending with momentum, or just chopping inside a tight opening range?
  •     Is implied volatility unusually high, or are premiums relatively cheap?
  1. Technical Confluence
  •     For calls: Is SPY holding firmly above VWAP? (For puts: Is it holding below?)
  •     Are short-term moving averages (like the 9 and 21 EMAs) stacked cleanly in your direction?
  •     Is volume actually expanding to support the breakout?
  1. Option Selection
  •     Is the bid-ask spread tight (ideally 1 to 2 cents wide)?
  •     Does the contract have enough Delta (around 0.40 to 0.60) to move predictably with SPY?
  •     Is there enough time left on the expiration to cushion against intraday Theta decay?
  1. Risk Limits
  •     Does this position size stay within your account’s maximum risk limit per trade?
  •     Is your stop-loss level hard-coded into your platform or strictly defined?
  •     Are you genuinely okay taking this loss if the setup fails?

Building a Process with MySpyOptions

Consistent trading isn’t about predicting the future or relying on a crystal ball. Long-term profitable traders spend far more energy managing risk, assessing option chain mechanics, and reviewing past mistakes than they do guessing where SPY will close today.

At MySpyOptions, we help traders move away from chasing “magic indicators” so they can build an actual operating process through our SPY and QQQ options trade alerts and educational training.

We focus heavily on the mechanics that actually drive P&L:

  •     How SPY and QQQ contract pricing behaves across different volatility regimes.
  •     Designing a realistic intraday trading plan around your personal schedule and risk limits.
  •     Managing the option Greeks — especially Delta, Gamma, and Theta — so you don’t get wiped out by IV crush.
  •     Conducting honest post-market trade audits so you stop making the same execution errors week after week.

For more structured breakdowns like this one, browse our full trading and options education library.

Frequently Asked Questions

What is the single biggest mistake people make when trading SPY options?

Entering positions without a written trade plan. When you don’t define your entry trigger, stop-loss level, and profit targets before opening a trade, you end up making frantic, emotional decisions the moment price moves quickly against you.

Why do traders lose money on options even when they get SPY’s direction right?

Mainly due to time decay (Theta) and implied volatility (IV) crush. Options pricing isn’t just tied to stock price — it’s heavily influenced by time and volatility expectations. If IV drops after you buy, or if SPY moves sideways for an hour, your contract can lose significant value even if the ETF eventually moves in your direction.

How can beginners protect their accounts from blowing up early on?

Keep your risk capped at 1% to 2% of your total account balance per trade. Avoid buying cheap, far-out-of-the-money “lottery tickets,” stick to liquid near-the-money strikes (0.40 to 0.60 Delta), and always know your exact stop-loss level before hitting the buy button.

Is scalping SPY options harder than just trading equity shares?

Yes, because options introduce extra variables. When trading shares, you only worry about price and volume. Options force you to manage changing bid-ask spreads, rapid Delta shifts, and accelerating intraday time decay, which demands much faster execution and tighter discipline.

Should you hold short-dated SPY options through major economic reports like CPI or FOMC?

Generally no. Implied volatility tends to spike right before major economic announcements and collapse immediately after the news hits. That sudden drop in IV can cause severe “IV crush,” deflating your option premium even if you guessed the directional spike correctly.

Do I really need to keep a trading journal?

Pretty much, yes. People remember their big wins in vivid detail and quietly forget the sloppy losses — that’s just how memory works. A journal removes the guesswork. Give it a few weeks and it’ll show you things you wouldn’t have noticed otherwise, like whether you’re actually better in the mornings or if one specific setup keeps bleeding you out.


Editor Notes: Pre-Publish Checklist (for content team — not part of the published article)

A few things to handle on the CMS/dev side before this goes live. None of these require changing the article text above.

Meta Title & Description (for CMS)

Meta Title: 10 Common SPY Options Mistakes & How to Fix Them | MySpyOptions

Meta Description: Learn the 10 most common SPY options mistakes — from FOMO entries to ignoring the Greeks — and the exact fixes disciplined traders use instead.


  •     Cboe stat (in “Why Is SPY Execution So Critical Right Now?”): sourced and attributed to Cboe’s Q2 2026 options industry report, paraphrased rather than quoted. Keep the Cboe attribution in place — don’t restate it as an in-house claim.
  •     FAQ section: wrap it in FAQPage schema markup on the back end (structured data only, not visible text) so it’s eligible for rich results and AI Overview extraction. The visible Q&A copy doesn’t need to change.
  •     Byline: confirm Srinivas is comfortable being credited by name, or swap in whichever author name the site uses consistently, and keep the “Updated [date]” line current going forward.
  •     Internal links: all 6 are already placed and hyperlinked in the body — see the linking map on the next page for a quick reference if anything needs updating.
  •     Optional next step: 2–3 supporting visuals (e.g., a Greeks cheat-sheet graphic, a risk-management chart) with keyword-rich alt text would strengthen this further, per the original SEO audit.


Appendix: Internal Linking Map (for content team — not part of the published article)

The links below are already placed and hyperlinked in the article body above. This table is just a quick reference for anyone reviewing or updating them — nothing here needs to be copied into the live page.

# Anchor Text Used Links To
1 “options scalping strategies that actually work” (intro) https://myspyoptions.com/options-scalping-strategies/
2 “how an option chain works” (Mistake #4) https://myspyoptions.com/what-is-an-option-chain-and-why-does-it-matter/
3 “trading weekly options for quick profits” (Mistake #10) https://myspyoptions.com/how-to-trade-weekly-options-for-quick-profits/
4 “choosing calls vs. puts” (Breakdown of a Failed SPY Trade) https://myspyoptions.com/call-option-vs-put-option/
5 “SPY and QQQ options trade alerts and educational training” (Building a Process section) https://myspyoptions.com/stock-options-trading-alert/
6 “trading and options education library” (closing line) https://myspyoptions.com/blogs/


Categories
Finance Options Trading

Best Time to Trade SPY Options During the Day

Written by the MySpyOptions team — 15+ years trading and teaching SPY and QQQ options, with a community of 1,000+ active traders.

If you’ve spent any real time trading SPY options, you already know the strange part: the exact same setup can behave completely differently depending on when you click the button. A clean breakout at 9:45 AM might hand you a fast 30% gain. Run that same pattern at 12:30 PM and it just… chops. Bleeds your premium. Goes nowhere.

Even your fills change. A contract that triggers instantly in the morning can leave you stuck with a wider bid-ask spread two hours later.

Most traders pour their energy into chart patterns and indicator settings and never once think about the clock. But if you’re asking when to trade SPY, timing isn’t a minor detail — it often matters as much as your entry signal itself.

SPY is one of the most liquid instruments on the planet, and its options market runs on a fairly predictable daily rhythm. Volume spikes and dies down at roughly the same points every session, spreads widen and narrow on a schedule, and real directional conviction tends to show up in the same windows day after day. Understanding SPY intraday trading time patterns is genuinely one of the higher-leverage things you can learn as an options trader — and it costs nothing to apply once you know it.

Quick Answer

The best time to trade SPY options is generally the first 60–90 minutes after the open (9:30–11:00 AM ET) and the final hour before the close (3:00–4:00 PM ET). These two windows consistently bring the heaviest institutional volume, the tightest spreads, and the cleanest directional price action.

That doesn’t mean the middle of the day is dead money for everyone — but the market’s internal mechanics shift hard as the session goes on, and that shift directly changes how your options get priced and filled.

Why Timing Moves the Needle: 4 Forces at Work

  1. Liquidity. This is just how easily you can get in and out without paying up for it. SPY options are liquid overall, but that liquidity isn’t flat across the day — it surges when big players are active and thins out when they step back. When it’s high, you get near-instant fills, penny-wide spreads, and minimal slippage. Losing two cents on entry and exit doesn’t sound like much on one contract, but multiply that across a few hundred trades a year and it’s a real drag on your edge.
  2. Volatility. This is the engine behind your profit potential — and your risk. The open typically brings the day’s sharpest volatility, since overnight news, global market moves, and institutional rebalancing all collide at once. Scheduled catalysts like CPI prints, jobs reports, and FOMC decisions can also spike volatility well outside the open. Volatility itself isn’t good or bad — it’s a tool. The goal is trading when it works with your setup, not fighting a market that’s simply drifting.
  3. Time decay (Theta). Premiums erode as expiration approaches, and for 0DTE or near-expiration contracts, that erosion accelerates hour by hour. Hold a short-dated contract through a slow, directionless stretch and you can watch value disappear even while SPY itself barely moves.
  4. Institutional participation. Big funds and algorithmic desks drive most of SPY’s volume, and their activity clusters heavily around the open, scheduled data releases, and the close. Knowing when that participation peaks helps you find the windows with real directional conviction instead of noise.

None of this is a niche phenomenon anymore, either. Same-day expiration trading has become a much larger share of the tape than it was even a couple of years ago — Cboe reported that SPX 0DTE contract volume climbed more than 46% year-to-date in Q2 2026 to over 20 million contracts a day, and ETF options volume overall is running near 28 million contracts daily. When that much same-day and short-dated flow is competing for fills in a handful of narrow windows, the gap between trading during peak hours and trading during the midday lull only gets wider. (Source: Cboe Global Markets, State of the Options Industry, Q2 2026)

How the SPY Session Actually Unfolds

Time (ET) What’s Happening Best Suited For
9:30 – 9:45 AM Opening chaos — huge volume, wild swings, wide initial ranges Experienced scalpers, tape readers
9:45 – 11:00 AM The “sweet spot” — volume stays high, moves start to follow through cleanly Most intraday traders
11:00 AM – 2:00 PM The midday lull — volume dries up, price drifts, Theta keeps ticking Best used for research, not entries
2:00 – 3:00 PM Afternoon wake-up — volume and conviction start rebuilding Trend and breakout traders
3:00 – 4:00 PM Power Hour — index rebalancing, closing auctions, decisive moves Trend followers, 0DTE traders managing risk tightly

Illustrative pattern of relative SPY trading volume by hour — volume peaks at the open and into Power Hour, and bottoms out during the midday lull.

9:30–9:45 AM: The Opening Bell Chaos

The first 15 minutes are mostly noise. Overnight headlines, economic data, and global market moves all get priced in at once, producing deep liquidity but also fast reversals. Picture SPY gapping up a full percent on a strong jobs report — retail buys calls right at the bell, and five minutes later institutional desks unload overnight longs into that strength, and the move reverses. Waiting even ten minutes for that initial surge to settle has saved a lot of traders from buying the top.

9:45–11:00 AM: The Real Window

This is where institutional footprints actually become visible. The wild opening whipsaws smooth out, and price starts respecting levels that matter — VWAP, key moving averages, prior day highs and lows. You’re no longer guessing whether a level will hold; you can actually watch it get tested. High liquidity without the 9:30 randomness, cleaner chart structure, and more predictable option pricing all show up here.

11:00 AM–2:00 PM: The Chop Zone

Wall Street effectively goes to lunch. Volume falls off, and SPY tends to drift in a tight, frustrating range. This window is genuinely dangerous for 0DTE or short-dated contracts — Theta keeps grinding down your premium even while the underlying barely twitches. The classic beginner mistake here is forcing a trade out of boredom. Recognizing that sitting out is itself a decision — and often the correct one — will save more capital over a trading career than almost any indicator will.

2:00–3:00 PM: The Afternoon Reset

Institutional rebalancing starts picking back up, volume creeps in, and breakouts start holding better than they did an hour earlier. Late-day Fed speakers or economic releases often land in this window too, acting as a warm-up for the final hour.

3:00–4:00 PM: Power Hour

The last 60 minutes tend to be the most electric stretch of the day. Between index rebalancing, closing auctions, and 0DTE traders fighting over gamma levels, SPY usually makes a decisive move into the bell. Watch VWAP holds or rejections, volume spikes on 5-minute candles, and breaks past the midday range — but keep risk tight, because the same energy that produces the biggest late-day gains can wipe out a contract just as fast if you’re on the wrong side.

Matching Your Strategy to the Market’s Mood

Rather than mechanically trading the same hour every day, it helps to match your window to the actual conditions in front of you:

Market Condition Best Window Strategy Focus
Strong directional trend 9:45 – 11:00 AM Buying pullbacks to VWAP / 9 EMA
Gap up or down at the open 9:45 – 10:30 AM Opening range breakouts
Choppy, sideways session Wait until 2:00 PM+ Afternoon range breaks
High implied volatility 9:30 – 10:30 AM Quick momentum scalps
Low volatility / tight compression 3:00 – 4:00 PM Power Hour trend continuation

Before you actually place the trade, run through a quick confluence check: Is price clearly above or below VWAP? Is relative volume expanding on the move, or is it a low-volume drift? Does RSI agree with the direction, or are you seeing divergence? Are your short- and medium-term moving averages actually stacked in favor of the trade? And can you realistically get 2:1 before hitting the next major support or resistance level? If most of those don’t line up, that’s usually your answer.

0DTE vs. Weekly Contracts: Timing Isn’t the Same for Both

0DTEs are hyper-sensitive to the clock because Delta, Gamma, and Theta are all moving at maximum speed. A $0.50 move in SPY can swing a same-day contract’s value by 30% or more. For 0DTE and scalping setups, stay disciplined about sticking to the 9:45–11:00 AM and 3:00–4:00 PM windows — taking these trades during the midday chop is one of the fastest ways to watch decay eat a contract while SPY goes nowhere.

Weekly contracts (3–7 days to expiration) decay much more slowly, which buys you room to be patient. Traders running straddle or strangle setups or comparing a call vs. put approach on weeklies often find better entries on late-morning pullbacks or afternoon retests, once the opening noise has cleared.

Five Mistakes That Quietly Burn SPY Traders

  • Buying right at the 9:30 open. You’re stepping into the widest spreads and the highest odds of an institutional fakeout of the day.
  • Ignoring the bid-ask spread. Even SPY spreads widen once volume drops — that slippage adds up fast during quiet stretches.
  • Trying to catch tops and bottoms. Fighting a clear intraday trend without real confirmation is usually a full-loss trade waiting to happen.
  • Trading out of boredom between 11:30 AM and 1:30 PM. Knowing when not to trade is arguably a bigger skill than knowing when to.
  • Ignoring the economic calendar. CPI prints, jobs reports, and FOMC minutes can move SPY sharply with little warning — always check what’s scheduled before you size a position.

Pre-Trade Checklist

  • Trend direction confirmed across more than one timeframe
  • Economic calendar checked for scheduled releases
  • Spreads are tight and liquidity looks clean on the contract you’re using
  • Entry, stop-loss, and target are mapped out before the order goes in
  • Risk-to-reward meets your baseline (2:1 minimum is a reasonable floor)
  • Position size is calibrated to what you can lose, not how confident you feel

FAQs

What is the best time to trade SPY options during the day? The strongest window is generally 9:45–11:00 AM ET, once the initial opening noise has settled but liquidity and momentum are still strong. The final hour, 3:00–4:00 PM ET, is the second major window, driven by institutional rebalancing and closing auctions.

Is it better to trade SPY options in the morning or afternoon? It depends on your style. Morning (9:45–11:00 AM ET) tends to suit scalpers and momentum traders looking for high-volume breakouts. Afternoon (2:00–4:00 PM ET) suits traders who prefer trend continuations and late-day VWAP setups. Most experienced traders simply sit out the middle of the day rather than force something in slow conditions.

Why should traders avoid SPY options during midday? Between roughly 11:30 AM and 2:00 PM ET, volume drops sharply and SPY tends to drift in a tight range. For short-dated or 0DTE contracts, this is where Theta decay does the most damage relative to how little the underlying actually moves.

Which indicators work best when trading SPY options? VWAP for tracking where institutional orders are anchored, EMA alignment (9 and 20) for short-term trend confirmation, RSI and MACD for momentum and exhaustion signals, and Volume Profile for identifying real support and resistance built from actual traded volume. No single indicator is a magic signal — using a few together in confluence is what filters out weak setups.

Does the ideal trading time change for 0DTE SPY options? Yes, and the margin for error shrinks considerably. Because 0DTE contracts carry extreme Delta, Gamma, and Theta sensitivity, poor timing shows up in your P&L almost immediately. Sticking to the first hour after the open or the final hour before the close matters even more here than it does for weekly or monthly contracts.

How can beginners get better at timing SPY options trades? Limit execution to the high-liquidity windows described above, map your entry, stop, and target before placing the order, risk a small fixed percentage of your account per trade, keep a trade log, and practice in a simulator until the process feels mechanical rather than emotional. Structured weekly options strategies can also be a lower-pressure way to build these habits before moving into faster 0DTE setups.

Final Thoughts

It’s easy to get absorbed in chart patterns and indicator settings and forget the clock entirely. But running a solid setup during the wrong part of the session is one of the more common ways a good strategy turns into a losing one.

For most retail accounts, 9:45–11:00 AM ET offers the best mix of tight spreads, real volume, and follow-through. Power Hour offers a second wave of opportunity for traders who know how to read institutional flow near the close. And just as important as knowing when to trade is knowing when not to — the midday chop has quietly cost more traders money than almost any bad indicator setting ever has.

Timing is only one part of a durable process, though. Reading price action, managing the Greeks under pressure, and keeping emotion out of your risk decisions all matter just as much. At MySpyOptions, we build our training around exactly that — a rules-based approach to SPY and QQQ options rooted in VWAP dynamics, volume profile, and disciplined risk management, rather than signals or guesswork. You can browse more strategy breakdowns, including on gamma squeezes and other options mechanics, on our blog.

Trading options involves substantial risk and isn’t suitable for every investor. This article is for educational purposes only and isn’t personalized investment advice — see our full disclaimer for details.


Categories
Finance Options Trading

How to Trade QQQ Options During Earnings Season (2026 Guide)?

Trading QQQ options during earnings season requires a completely different strategy than trading during normal market conditions. Since the Invesco QQQ Trust (QQQ) is an index weighted toward leading technology companies such as Apple Inc., Microsoft Corporation, NVIDIA Corporation, Amazon.com, Inc., and Meta Platforms, Inc., earnings season often leads to volatile market conditions.

To trade QQQ options successfully during earnings season, it is essential to understand how these trades work.


What Makes QQQ Different During Earnings Season?

QQQ behaves differently during earnings season because many of its largest holdings report earnings within a short period, creating concentrated market volatility. As a result, traders often experience larger price swings, increased trading volume, and higher options premiums.

Unlike broad-market ETFs, QQQ is heavily weighted toward large-cap tech stocks. Earnings reports from companies like Apple, Microsoft, and NVIDIA can significantly influence the performance of the entire ETF.

1. Higher Implied Volatility (IV)

Options premiums typically rise before earnings as traders anticipate larger price movements. This makes buying options more expensive.

2. Market Makers’ Correlated Movement

If several major holdings exceed or miss expectations, QQQ will respond with significant movement in either direction.

3. Gamma Exposure

During earnings weeks, market makers frequently adjust their positions, leading to aggressive intraday movements.


What Is the Best QQQ Options Earnings Strategy?

The most effective QQQ options earnings strategy depends on volatility, sentiment, and earnings concentration during a given time.

Below you’ll find the most effective strategies:

Strategy 1: Momentum Play Before Earnings

This QQQ options earnings strategy seeks to capitalize on bullish or bearish momentum before major technology companies announce their earnings.

Action Plan:

  • Check important earnings dates using the Nasdaq Earnings Calendar & TradingView
  • Monitor premarket performance
  • Look for strength across the technology sector.

For example, if both NVIDIA and Microsoft provide positive earnings guidance ahead of their reports, it is possible that QQQ may build bullish momentum before earnings are released.

Impact: Capture momentum leading into earnings announcements.


Strategy 2: Post-Earnings Breakout Strategy

Rather than risking money on the stock before the event, wait for confirmation.

Strategy Framework:

Step 1: Let the earnings report come out.

Step 2: Wait for the opening range

Step 3: Trade the breakout above resistance or below support.

Reasons for effectiveness: Avoids IV crush and trades actual momentum.


Tool → Function:

  • TradingView → Chart analysis
  • thinkorswim → Options chain analysis
  • Market Chameleon → IV data


Strategy 3: Long Straddle Strategy

This QQQ options earnings strategy involves buying both a call option and a put option simultaneously, creating a long straddle.

Best for:

  • Uncertain market direction
  • Significant price move expected

Issue → Solution:

Uncertainty of market direction → Use a long straddle strategy to profit from a significant move in either direction.

Risk: If price movement remains limited after earnings, the premiums paid for both options may result in a loss.


How to Analyze QQQ Before Trading Earnings?

A profitable QQQ earnings trading approach starts with preparation.


Factor Why It Matters
Implied Volatility Indicates expected price movement
Major Holdings Earnings Directly impact QQQ
Nasdaq Futures Indicates tech sentiment
Economic Data Can amplify market volatility
Options Flow Reveals institutional positioning


Step-by-Step Pre-Earnings Analysis

Step 1: Review the Earnings Schedule

Use Nasdaq, MarketWatch, or Earnings Whispers to identify when QQQ’s largest holdings will report earnings. 


Step 2: Evaluate Expected Move

Examine the ATM straddle premiums.

Formula: Expected move = Call premium + Put premium


Step 3: Monitor Unusual Volume

Higher-than-normal options volume may indicate institutional activity


Step 4: Identify Important Technical Levels

Mark important support and resistance levels, VWAP, and recent highs and lows before entering a trade.


Proper preparation significantly improves the quality of your trading decisions.


Common Mistakes Traders Make When Trading QQQ Earnings

Even experienced traders can make costly mistakes during earnings season.


1. Ignoring IV Crush

Implied volatility falls sharply post-earnings, making the options less expensive.

For example, QQQ may move higher after earnings, yet call options can still lose value because implied volatility drops significantly.


2. Trading Too Far OTM

Out-of-the-money (OTM) options are less expensive, but they require larger price movements to be profitable.

Recommended strategy: Trade at-the-money or slightly in-the-money options.


3. Overleveraging

Large post-earnings price swings can quickly result in substantial losses if position sizes are too large.

Risk Management Rule

Risk no more than 1%–2% of your total trading capital on a single trade.


4. Ignoring Macroeconomic Catalysts

Federal Reserve announcements, CPI reports, employment data, and other economic releases can easily outweigh earnings-driven momentum.

Monitoring the Federal Reserve Economic Calendar helps traders prepare for major macroeconomic events before placing trades.


Real Example: QQQ During NVIDIA Earnings

During one earnings season, NVIDIA reported results well above market expectations.


Use case:
  • NVIDIA reported earnings that exceeded expectations.
  • Guidance was bullish.
  • The semiconductor stocks rallied sharply.
  • QQQ opened approximately 2.1% higher.


Trader setup:

A trader could have benefit by purchasing QQQ 0DTE call options after a confirmed breakout above the pre-market high.


How does this work?

Because NVIDIA represents one of QQQ’s largest holdings, strong earnings created bullish momentum across the technology sector, lifting the ETF.

This illustrates how earnings reports from major constituents can create attractive trading opportunities in QQQ.


QQQ Earnings Strategies Comparison


Strategy Best For Risk Level Reward Potential
Pre-Earnings Momentum Trend traders Medium High
Post-Earnings Breakout Confirmation traders Low-Medium High
Long Straddle Volatility traders High High
Debit Spread Controlled risk traders Low Medium
Scalping 0DTE Advanced traders Very High Very High


The best strategy depends on your experience level, market outlook, and personal risk tolerance.


Pro Checklist for Trading QQQ Earnings

Apply this custom framework before every earnings trade:


The M.E.T.A. Framework

M = Monitor Top Earnings Stocks

Keep track of the top QQQ stocks.


E = Evaluate Implied Volatility

Avoid overpaying for option premiums


T = Technical Validation

Wait for technical confirmation before entering a trade.


A = Adjust Your Risk Management

Use proper sizing and stop-loss levels.


Following this framework can improve consistency over time.

Many retail traders focus only on market direction, while experienced options traders pay equal attention to volatility, timing, and risk management.


Why Traders Use Myspyoptions for QQQ Earnings Trading

Earnings trading requires quick decision-making. Having access to expert guidance can make a meaningful difference.

Myspyoptions has more than 15 years of experience in stock trading. We specialize in SPY and QQQ option trades. The company helps traders simplify complex market movements through structured trade setups, educational resources, and timely market analysis.

Alerts based on high-probability market setups.

  • Specialized SPY & QQQ Options Alerts

Ideal for traders who want to trade options on indexes.

  • Training Programs

Learn proven trading strategies from experienced market professionals.

  • Daily Market Analysis

Stay updated daily with expert insights.

For improved QQQ option trades, let Myspyoptions help you with everything you need.


Are you interested in improving your earnings from trades? Sign up now with Myspyoptions and start getting QQQ option alerts.


Conclusion

Trading QQQ during earnings season can be highly rewarding, but success depends on having the right strategy, thorough preparation, and disciplined risk management. The best QQQ options earnings strategy involves understanding implied volatility, conducting technical analysis, and timing trade. Whether you prefer momentum strategies, post-earnings breakout trades, or volatility-based setups, understanding how QQQ reacts to major earnings announcements is essential.

If you’re looking to improve your QQQ earnings trading strategy, platforms such as Myspyoptions can help you make more informed trading decisions.


FAQs

  1. Is QQQ good for earnings trading?

Yes, QQQ is an extremely active ETF during earnings season because it is heavily weighted toward leading technology companies that often experience significant price movements after reporting earnings.

  1. What is the safest strategy to trade QQQ earnings?

Post-earnings breakout strategies are considered safer because it avoids event risk and the effects of implied volatility (IV) crush.

  1. Can beginners trade QQQ during earnings?

Yes, however, beginners should engage only in defined-risk strategies like debit spreads.

  1. How do I measure QQQ’s earnings effect?

You can monitor using the Nasdaq Earnings Calendar, TradingView, and Market Chameleon.

  1. What is the biggest mistake in trading QQQ earnings?

The biggest mistake is ignoring IV and paying excessive option premiums before earnings.


Categories
Finance Options Trading

How to Read SPY Options Chain Like a Pro (2026 Guide)?

The SPY options chain is probably one of the most effective tools traders can use to gauge market sentiment, identify potentially profitable setups, and optimise the timing of entries and exits. By learning how to read the SPY options chain effectively, you can identify areas of liquidity, support and resistance, and determine the best times to trade SPY options.

In this guide, you’ll learn how to read the SPY options chain like a professional, discover the best time to trade SPY options, understand SPY intraday trading hours, and improve your intraday trading skills.


What Is a SPY Options Chain?

The SPY options chain contains all available call and put option contracts related to the exchange-traded fund SPDR S&P 500 ETF Trust (SPY). It provides traders with valuable market information, including:

  • Strike prices
  • Bid/ask prices
  • Volume
  • Open interest
  • Implied volatility
  • Delta, Gamma, Theta, Vega

In essence, an options chain serves as a live snapshot of trader positioning. While price charts reflect past market activity, an options chain provides insight into potential future price movements. 


Why Reading the SPY Options Chain Matters?

Most traders primarily rely on candlestick charts. However, professional traders combine chart analysis with options chain data because it provides deeper insight into market positioning and trader sentiment.

1. Market Positioning

The open interest indicator helps identify where institutional and large market participants have positioned their capital.

For instance, if SPY has exceptionally high call open interest around the 620 strike price, that level is likely to act as a significant resistance zone.

2. Identify Liquid Trading Areas

Higher trading volume generally results in greater liquidity, making it especially important for scalpers and intraday traders.

3. Identify Possible Pinning Levels

As expiration approaches, SPY often gravitates towards strike prices with significant open interest.

4. Analyze Implied Volatility

Implied volatility helps determine whether option premiums are relatively expensive or inexpensive.


Problems → Solutions:

Unknown entry points → Analyze Implied volatility and trading volume.

How to Read SPY Options Chain Step by Step?

1. First Step: Choose The Right Expiration

The first step is choosing the appropriate expiration date.

For SPY, the choices include:

  • Same Day Expiry (0DTE)
  • Weekly Expiration
  • Next Day Expiration

Since these options expire within a very short period, their prices respond quickly to intraday price movements.

Best suited for:

  • Scalpers
  • Momentum Traders
  • News Trading

If you are an intraday trader, choose same-day expiry contracts, since their premiums move quickly due to high gamma.


2. Select At-The-Money Options

At-the-money (ATM) options are those with strike prices closest to SPY’s current market price.

For instance:

SPY Price: 612

Recommended contracts:

  • 612 Call
  • 612 Put

These contracts generally:

  • Have the highest trading volume
  • Offer excellent liquidity
  • Feature fairly priced premiums

These options are best suited for beginners.

Tool → Function:

ATM Strike = Better liquidity + Efficient execution


3. Analyse Open Interest

Open interest indicates the number of active option contracts.

Higher open interest generally indicates stronger market participation and better liquidity.

General Framework:

  • High Calls OI = Resistance Zone
  • High Puts OI = Support Zone

For example:

Strike Price Call OI Put OI
610 18,000 9,500
615 32,000 8,200
620 41,500 6,100

Interpretation: 620 could become an important resistance level.

Hence, open interest helps traders identify potential market barriers.


4. Monitor Volume for Intraday Signals

Trading volume reflects the current level of market activity and is often more important than open interest for intraday traders. 

Points to keep in mind:

  • Rising call volume indicates bullish momentum.
  • Rising put volume indicates bearish momentum.
  • Unusually high volume frequently suggests institutional participation.

Ultimately, trading volume reflects current market interest and can help confirm trade setups.

Strategy → Result:

Use trading volume → Higher-confidence entries


5. Watch the Bid-Ask Spread

A tighter bid-ask spread is generally preferable.

For instance:

  • Good Bid/Ask: 2.50 – 2.53
  • Poor Bid/Ask: 2.50 – 2.90

A wider spread often results in increased slippage, reducing profitability.

Whenever possible, trade highly liquid contracts with tight bid-ask spreads—especially during the most active SPY trading hours.


6. Use Delta for Trend Identification

Delta measures how much an option’s price is expected to change for every $1 move in SPY.

For example:

  • Delta: 0.50
  • SPY rises by $1.
  • The option premium increases by approximately $0.50

General Guidelines:

  • A delta of 0.30 – 0.40 is cheap and less sensitive.
  • 0.50 – 0.70 is neutral.
  • 0.80+ is expensive and highly sensitive.

For most intraday traders, a delta between 0.40 and 0.60 offers an effective balance between responsiveness and affordability.


What Is the Best Time to Trade SPY Options?

Perhaps one of the most critical questions traders ask is when to trade SPY?

The most favourable SPY intraday trading periods are typically during the market open and the final hour of the trading session.


Market Open (9:30 AM – 11:00 AM EST)

This time slot offers:

  • High volatility
  • High trading volume
  • Strong price movements 

Good for momentum traders.


Power Hour (3:00 PM – 4:00 PM EST)

The final trading hour is another favourable period for trading SPY options.

During this time:

  • Institutional traders often rebalance their portfolios.
  • Trading volume increases significantly.
  • Volatility typically rises.

Strong directional moves frequently develop before the market closes.


Comparison table:

Time Window Volatility Best For
9:30–11:00 AM Very High Scalping, Breakouts
11:00–1:30 PM Low Avoid / Low conviction
1:30–3:00 PM Medium Trend continuation
3:00–4:00 PM High Power hour setups

Key takeaway:

If you’re wondering when to trade SPY options, focus primarily on the market open and the Power Hour, when liquidity and volatility are typically at their highest.


Common Mistakes Traders Make While Reading the SPY Chain

Ignoring Open Interest

OI helps identify support and resistance areas.

Trading Illiquid Strikes

Slippage occurs due to low volume.

Buying during Periods of Low Volatility

Intraday premiums may be affected by low midday volatility.

Ignoring Implied Volatility

Ignoring IV may result in paying excessively high premiums or purchasing options that have limited profit potential.

Ignoring Time-Based Approach

Understanding SPY intraday trading hours is just as important as identifying the right strike price.


Pro-Level SPY Options Chain Framework

Follow this 5-step framework:

Step 1: Identify market bias

Begin by analyzing the SPY price chart and overall market direction.

Step 2: Identify the highest OI

Locate strike prices with the largest concentration of open interest.

These levels frequently act as important support and resistance zones.

Step 3: Watch real-time volume

Observe whether buying or selling activity is increasing.

Step 4: Trade only when volume is highest

Enter trades only when trading volume supports the setup.

Step 5: Choose ATM or near-ATM options

At-the-money or near-the-money contracts typically provide:

  • Better liquidity
  • Fairer premiums
  • Faster price movement
  • Easier trade execution


For example: An options trader observes SPY at the 615 level with heavy call OI at 620 and increasing volume at 617.

Conclusion: Bullish market with resistance ahead.

Trading strategy: Buy 617 call options during the day’s breakout.

Outcome: If momentum continues, the option premium appreciates as SPY advances toward resistance.

Following a structured framework like this helps traders make disciplined, data-driven decisions instead of relying on emotion.


Why Traders Trust Myspyoptions

Understanding SPY and QQQ options becomes much simpler with experience.

With over 15 years of market experience, Myspyoptions has helped more than 1,000 traders develop practical options trading skills by simplifying complex market concepts into actionable trading strategies.

What Myspyoptions offers:

  • Alerts for SPY, QQQ options & stock options
  • SPY & QQQ alert only services
  • Professional options trading coaching
  • Daily Market Insights
  • Regular market updates
  • Battle-tested options trading strategies

Instead of guessing your SPY entry points, you can make more informed trading decisions using proven strategies developed through years of market experience.


Ready to learn how to trade SPY options quickly?

Sign up with Myspyoptions now and benefit from real-time SPY and QQQ alerts, professional guidance, and proven trading strategies based on 15 years of market experience.

Conclusion

Reading the SPY options chain is just not about analysing numbers—it is also about understanding market psychology.

By combining:

  • Open Interest
  • Volume
  • Delta
  • Market Time
  • Liquidity

traders gain valuable insights that many retail investors overlook.

Learning to interpret the options chain systematically can help you identify stronger trading opportunities, improve your timing, and make more informed decisions.

If you require further assistance on options trading in the US, please contact Myspyoptions.


FAQs

1. What should beginners focus on while reading an SPY options chain?

Beginners should concentrate on four key factors:

  • At-the-money (ATM) strike prices
  • Trading volume
  • Open interest
  • Expiration dates

These metrics provide a solid foundation for understanding market activity and selecting appropriate trades.

2. What is the best time to trade SPY options?

It is ideal to trade between 9:30–11:00 AM and 3:00–4:00 PM. These sessions typically offer the highest trading volume and volatility.

3. Why is open interest important?

Open interest helps identify potential support and resistance levels

4. Which is better, SPY or QQQ, in options trading?

SPY generally offers greater liquidity and tighter bid-ask spreads, making it suitable for a wide range of traders.

QQQ, on the other hand, tends to experience larger price swings due to the higher volatility of technology stocks, offering greater profit potential—but also higher risk.

5. When should I not trade SPY intraday?

Avoid trading during midday hours when trading volume and volatility typically decline unless there is significant market news or a strong trend continuation.


Categories
Finance Options Trading

Best SPY Options Trading Strategies for Consistent Profits

SPY options trading has become one of the most popular ways traders participate in the U.S. stock market. From beginner traders to experienced professionals, many prefer SPY options because of their liquidity, tight spreads, and consistent price movement during market hours.

Whether your goal is intraday trading, momentum trading, or short-term income opportunities, understanding the right SPY options trading strategies can help improve discipline, risk management, and execution.

In this guide, we’ll cover some of the best SPY options trading strategies, how they work, and how traders use them in real market conditions.

What Are SPY Options?

SPY options are options contracts based on the SPDR S&P 500 ETF (SPY), one of the most actively traded ETFs in the world. Since SPY tracks the S&P 500 Index, traders use SPY options to gain exposure to the broader U.S. stock market.

SPY options are popular because they offer:

  • High daily trading volume
  • Tight bid-ask spreads
  • Multiple expiration dates
  • Strong liquidity
  • Reliable intraday price movement

These characteristics make SPY options suitable for both beginners and active day traders.

Why Traders Prefer SPY Options?

Before learning strategies, it’s important to understand why SPY options trading is so widely used.

1. High Liquidity

SPY options have some of the highest trading volumes in the options market. High liquidity helps traders enter and exit positions more efficiently.

2. Tight Spreads

Because of heavy trading activity, SPY options generally have tight bid-ask spreads, which can reduce trading costs.

3. Consistent Volatility

SPY moves consistently during U.S. market hours, making it attractive for momentum and intraday traders.

4. Multiple Trading Opportunities

SPY supports:

  • Intraday trading
  • Swing trading
  • 0DTE trading
  • Breakout setups
  • Hedging strategies

Best SPY Options Trading Strategies

Below are some of the most commonly used SPY options trading strategies for active traders.

1. Intraday SPY Options Trading Strategy

Intraday trading involves opening and closing positions within the same trading day.

Many traders use SPY options for intraday setups because SPY reacts quickly to:

  • Market sentiment
  • Economic news
  • Volume spikes
  • Federal Reserve announcements
Common Intraday Setup

Traders often look for:

  • Breakouts above resistance
  • Breakdowns below support
  • VWAP confirmation
  • Strong volume expansion

Example:

If SPY breaks above a key resistance level with strong volume and bullish momentum, traders may enter call options with a defined stop-loss.

Important Intraday Rules
  • Avoid overtrading
  • Trade only during high-volume sessions
  • Use strict stop-loss levels
  • Focus on risk management

2. 0DTE SPY Options Strategy

0DTE stands for “Zero Days to Expiration.” These are options contracts that expire on the same day they are traded. 

0DTE SPY options have become extremely popular because they offer:

  • Fast price movement
  • Lower premium costs
  • Multiple intraday opportunities

However, they also carry high risk because option premiums decay rapidly.

How Traders Use 0DTE SPY Options?

Many traders utilize:

  • Momentum breakouts
  • Scalping strategies
  • News-based volatility setups
  • Opening range breakouts
Risk Management Is Critical

Since 0DTE contracts move aggressively:

  • Position sizing matters
  • Emotional trading should be avoided
  • Traders should define exits before entry

Because of these factors, 0DTE trading is generally better suited for experienced traders.

3. SPY Breakout Trading Strategy

Breakout trading is one of the most commonly used SPY options strategies.

The goal is to identify key levels where SPY may move aggressively after breaking through support or resistance.

What Traders Watch?

Common breakout signals include:

  • Volume expansion
  • Price consolidation
  • VWAP alignment
  • Momentum confirmation
Bullish Breakout Example

A trader may buy SPY call options if:

  • SPY breaks above resistance
  • Volume increases significantly
  • Market momentum remains bullish
Bearish Breakout Example

A trader may buy put options if:

  • SPY breaks below support
  • Selling pressure increases
  • Market breadth weakens

4. Trend-Following SPY Strategy

Trend-following strategies focus on trading in the direction of the overall market trend.

Instead of trying to predict reversals, traders aim to ride existing momentum.

Common Trend Indicators

Many SPY traders use:

  • Moving averages
  • VWAP
  • Trendlines
  • Higher highs and higher lows
Why Trend Trading Works?

SPY often develops strong directional trends during:

  • Major Economic events
  • Earnings seasons
  • Federal Reserve announcements
  • High-volume trading sessions

Following established trends may help traders avoid unnecessary countertrend trades.

5. SPY Options Scalping Strategy

Scalping involves taking multiple small trades throughout the trading session to capture micro-movements.

SPY options are commonly used for scalping because of:

  • Quick price movement
  • Strong liquidity
  • Active intraday volatility
Scalping Focus Areas

Scalpers often trade:

  • Opening range breakouts
  • Quick momentum shifts
  • VWAP bounces
  • Short-term support and resistance reactions
Important Scalping Tips
  • Use fast execution
  • Keep losses small
  • Avoid emotional decisions
  • Stick to predefined setups

Scalping requires discipline and fast decision-making.

Risk Management for SPY Options Trading

No strategy works consistently without proper risk management.

Many traders focus solely on entries while completely ignoring position sizing and risk control.

Key Risk Management Rules
1. Use Defined Stop-Losses

Always know your maximum acceptable loss before entering a trade.

2. Avoid Oversized Positions

Risking too much capital on one trade can damage long-term consistency.

3. Focus on Risk-to-Reward Ratio

Many successful traders prefer setups where potential reward outweighs risk.

4. Avoid Emotional Trading

Revenge trading and impulsive decisions often lead to poor execution.

5. Trade High-Probability Setups Only

Patience is important in SPY options trading.

Common Mistakes SPY Traders Should Avoid?

Even experienced traders make mistakes. Some common issues include:

Overtrading

Taking too many trades reduces discipline and spikes emotional decision-making.

Ignoring Market Conditions

Volatility shifts and news events can dramatically impact SPY’s price movement.

Trading Without a Plan

Every trade should include:

  • A clear entry
  • Stop-loss
  • Profit target
  • Calculated position size
Chasing Trades

Entering a position late after a major move has already occurred increases your risk significantly. 

How MySpyOptions Helps SPY Traders?

MySpyOptions is a SPY & QQQ options trading advisory and mentorship service focused on helping traders improve decision-making, risk management, and market execution.

With 15+ years of market experience, the advisory focuses on:

  • Real-time SPY options alerts
  • Live market guidance
  • Structured options trading training
  • Risk-managed trading approaches
  • SPY and QQQ focused strategies

Rather than promoting emotional or hype-driven trading, MySpyOptions emphasizes disciplined execution, market structure, and defined-risk setups.

FAQ’s

  1. What are SPY options?

    SPY options are options contracts based on the SPDR S&P 500 ETF (SPY), allowing traders to speculate on the movement of the S&P 500 Index.

  2. Are SPY options good for beginners?

    Many beginners prefer SPY options because of their deep liquidity and consistent market activity. However, proper education and risk management are important before starting.

  3. What is the best SPY options trading strategy?

    There is no single best strategy. Common approaches include:

    • Intraday trading
    • Breakout trading
    • Trend-following
    • 0DTE trading
    • Scalping
      The best strategy depends on a trader’s experience, risk tolerance, and current market conditions.
  4. What is 0DTE SPY trading?

    0DTE refers to options contracts expiring on the same day. These trades are highly active and involve rapid price action.

  5. Why do traders prefer SPY over individual stocks?

    SPY offers:

    • High liquidity
    • Tight spreads
    • Consistent volatility
    • Exposure to the broader market

Final Thoughts

SPY options trading offers multiple opportunities for traders seeking short-term market exposure and structured trading setups.

Whether you prefer:

  • Intraday trading
  • Breakout setups
  • Scalping
  • Trend-following strategies
  • 0DTE opportunities

success ultimately depends on our core pillars:

  • Discipline
  • Risk management
  • Consistent execution
  • Structured decision-making

Instead of chasing random trades, traders should focus on building repeatable processes and understanding market behavior over time.

If you want to improve your SPY options trading approach, combining quality education, structured alerts, and disciplined execution can help create a more consistent trading framework.