
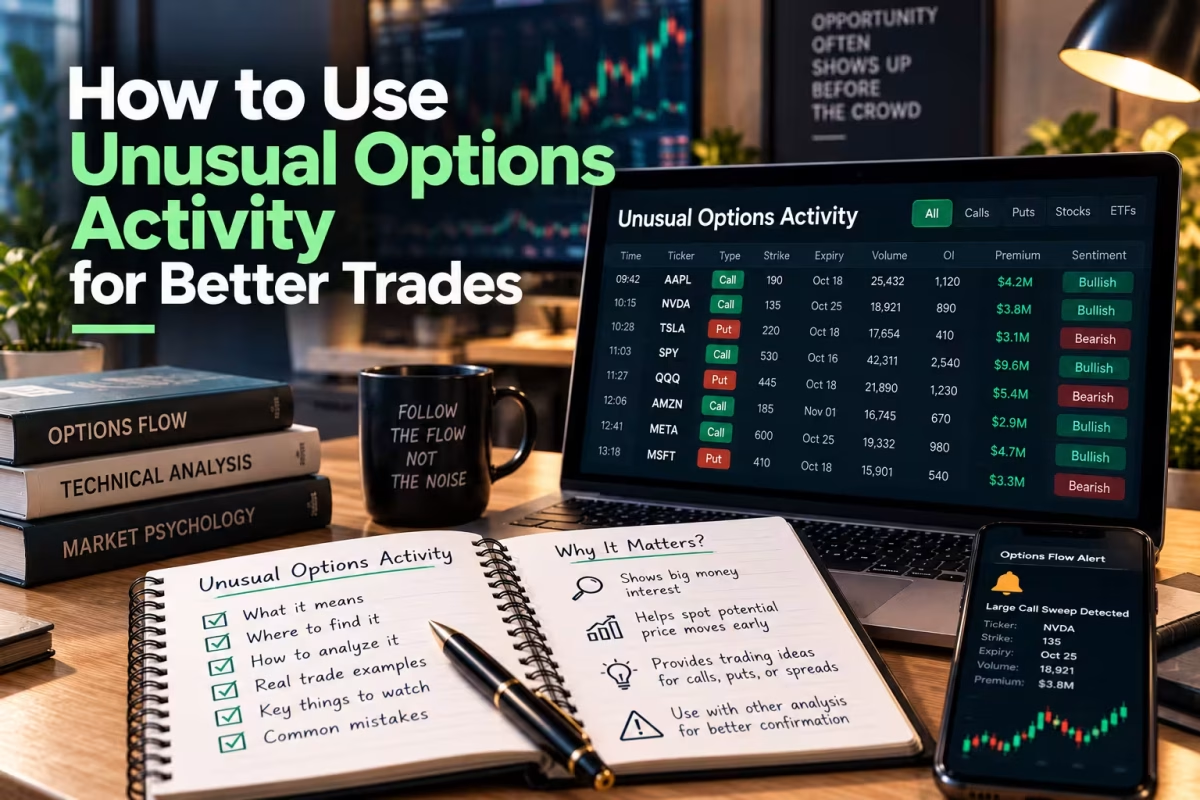
If you trade options on SPY or QQQ, you’ve probably seen a flow alert flash across your screen — a block of calls three times the average volume, or a sweep that looks too aggressive to ignore. The instinct is to treat it as a tip. It isn’t one.
Unusual options activity (UOA) is a genuinely useful signal, but it’s a research signal, not a trade signal. A large call or put print doesn’t tell you whether a trader is bullish or bearish, and it certainly doesn’t guarantee where price goes next. The real edge comes from combining that flow with the options chain, price action, implied volatility, and a few technical levels — then deciding whether the setup is actually worth the risk.
Quick answer: Unusual options activity flags where attention is building in the options market. It doesn’t tell you why it’s building or whether the trade will work. Treat it as a starting point for research, confirm it against price action, and only then build a risk-defined trade around it.
What Counts as “Unusual,” Exactly?
There’s no exchange-mandated threshold for unusual options activity — no regulator hands out a rulebook that says “5,000 contracts = noteworthy.” Scanners build their own definitions using volume relative to open interest, historical volume, premium size, and how aggressively the order was executed.
That’s why context matters more than the raw number. A 5,000-contract trade can be extraordinary in one name and routine in another. A few quick comparisons:
- High volume paired with low historical activity → worth a second look
- High volume in an already hyper-liquid SPY strike → often just noise
- A large call trade against a falling underlying → needs investigating before you assume anything bullish
- A large put trade during a rally → could easily be a hedge, not a bearish bet
- High volume with unchanged open interest → not proof anyone opened a new position
Volume vs. open interest, briefly: volume is contracts traded today. Open interest is contracts still outstanding after the prior session’s clearing. High volume relative to OI tells you a contract is unusually active — it does not tell you that every one of those contracts represents a fresh directional bet. Confusing the two is probably the single most common mistake in flow analysis.
A Four-Step Framework: Signal → Context → Confirmation → Risk
1. Signal — what actually looks unusual?
Start with the raw mechanics: contract volume, the volume/OI relationship, estimated premium, strike, expiration, whether it printed as a sweep or a block, and where it executed relative to the bid/ask. One large print is interesting. Several related prints — same strike, similar timing, growing size — are more informative, because they hint at concentration and persistence rather than a single one-off order.
2. Context — why might this trade exist?
Before you assign a direction to anything, check what’s actually happening around it: the economic calendar, upcoming earnings, Fed announcements, CPI or jobs data, sector strength, and where SPY or QQQ sit relative to known support and resistance. Skipping this step is how traders end up reading a hedge as a bearish bet, or a rolled position as a brand-new one.
3. Confirmation — does price agree with the flow?
Say you spot heavy call buying in QQQ. On its own, that’s not a trade. Ask whether QQQ is actually holding above VWAP, whether it’s printing higher highs on expanding volume, whether RSI is confirming momentum rather than flashing exhaustion, and whether MACD supports the move. The same logic runs in reverse for puts. Flow without price confirmation is a lead, not a thesis.
4. Risk — where does the idea get proven wrong?
Before you enter anything, define your maximum dollar risk, position size, entry, stop-loss or technical invalidation level, profit target, and a time limit. This is the step that turns an interesting alert into an actual trading plan instead of a hunch with a ticker attached.
The Five UOA Signals Worth Watching Most
- Volume relative to open interest. A contract trading several multiples of its displayed open interest deserves a closer look — but a high volume/OI ratio alone doesn’t prove new buying. It could just as easily be closing activity, a roll, or one leg of a spread.
| Metric | Observation |
| Open interest | 2,000 |
| Session volume | 12,000 |
| Volume/OI | 6× |
| Expiration | 14 days |
| Strike | Slightly OTM |
That’s a real spike. It still doesn’t tell you whether it’s buying, selling, or something structural like a roll.
- Sweep orders. A sweep — an order routed aggressively across multiple exchanges to grab available liquidity — is a genuine urgency signal. It’s a timing clue, not proof that the trader behind it knows something you don’t.
- Block trades. A large block at the ask can look bullish on the surface, but it might be a hedge, one leg of a spread, a closing trade, a roll, or a fresh directional bet. “Block” and “institutional bullish conviction” are not the same thing, however often they get treated that way.
- Premium concentration. Estimated premium tells you where dollars are concentrated — it’s not the same as confirmed directional capital. A large headline premium can just as easily come from high volume, an expensive option, or both.
- Expiration and strike concentration. When activity clusters around one expiration and a handful of nearby strikes, it often signals a time-sensitive thesis. For SPY, that usually means watching macro catalysts and broad index levels. For QQQ, technology-sector leadership and mega-cap earnings tend to matter more.
SPY vs. QQQ: Why the Same Signal Means Different Things
SPY tracks the S&P 500 — broad, large-cap, heavily influenced by macro and rate expectations. QQQ tracks the Nasdaq-100 — more concentrated, more tech-and-growth-driven, and typically more reactive to individual mega-cap earnings.
| Factor | SPY Options | QQQ Options |
| Underlying exposure | Broad U.S. large-cap market | Nasdaq-100 |
| Main context | Macro, rates, CPI, Fed policy | Tech leadership, growth, mega-cap earnings |
| Useful confirmation | Trend, VWAP, breadth, major levels | Momentum, tech leadership, major levels |
| Typical UOA interpretation | Often tied to hedging or index positioning | Reacts sharply to sector catalysts |
| Key risk | Macro reversals, volatility shifts | Fast momentum reversals |
Unusual put activity in SPY is frequently portfolio hedging rather than a directional bet. A large QQQ position built around a known tech catalyst usually has a more obvious event-driven explanation. Either way, the lesson is the same: calls and puts don’t carry a fixed meaning. Context decides that.
A Repeatable Process You Can Run Every Session
Step 1 — Start with the underlying, not the flow. Look at SPY or QQQ first: trend, support/resistance, VWAP, moving averages, volume, RSI, MACD, and any major catalyst on the calendar.
Step 2 — Find what’s actually unusual. Filter for volume, volume/OI, premium size, sweeps, blocks, repeated prints, and strike or expiration concentration.
Step 3 — Ask if the flow has a plausible explanation. Directional speculation, hedging, earnings positioning, volatility trading, spread construction, a roll, or simple profit-taking can all produce the same-looking print. If you can’t land on a reasonable explanation, don’t force one.
Step 4 — Check the flow against price.
| UOA | Price Action | Interpretation |
| Bullish-looking calls | Bullish breakout | Stronger confirmation |
| Bullish-looking calls | Price below resistance | Wait for confirmation |
| Heavy puts | Bearish breakdown | Stronger confirmation |
| Heavy puts | Price rising | Investigate possible hedge |
| Calls and puts both elevated | Choppy market | Possibly volatility/spread activity |
| Huge volume, no price response | — | No confirmation — treat cautiously |
Step 5 — Build the trade around risk, not around the flow print itself. You don’t need to copy the exact contract that showed up on the scanner. A different strike, expiration, or a defined-risk spread may fit your actual thesis better — and your risk-to-reward should be decided before you’re in the trade, not after.
Mistakes That Quietly Wreck a UOA-Based Process
It’s easy to assume every call is bullish, but calls get sold, hedged, and folded into spreads constantly. The reverse mistake is just as common: a fund holding a large equity position will often buy puts purely for protection, not because it’s turned bearish.
Volume and open interest also get conflated more than they should. They’re different measurements, and high volume alone doesn’t tell you who opened or closed a position. There’s also a timing trap — by the time a large trade becomes visible on a scanner, its premium may have already moved meaningfully, so chasing the exact contract often means chasing a worse price than the original trader got.
Implied volatility is another blind spot. Even if the underlying moves the way you expected, falling IV can still erode the option’s value and eat into — or erase — the gain. And oversized position sizing turns leverage from a tool into a liability: the SEC has been explicit that option buyers can lose their entire premium, and some option-writing strategies carry risk well beyond that. The most important reminder ties all of this together — unusual doesn’t mean correct. UOA tells you something unusual happened. It says nothing about whether the trader behind it will be proven right.
The 10-Point UOA Checklist
Before acting on any unusual options activity alert, run through this:
- Is the underlying trending?
- Is the activity genuinely unusual for that specific contract?
- How large is volume relative to open interest?
- Is the activity concentrated in one strike or expiration?
- Does the execution suggest urgency (sweep vs. routine order)?
- Could this be a hedge or part of a spread?
- Is there a known catalyst behind it?
- Does price action confirm the apparent direction?
- Is implied volatility reasonable for this setup?
- Where does the trade get invalidated, and how much are you willing to lose?
If more than a couple of these come back unclear, waiting is usually the better trade than forcing one.
Learn SPY and QQQ Options Trading with MySpyOptions
Reading options flow gets a lot easier once you actually understand the underlying market first — which is a big part of why structured education matters here. At MySpyOptions, the focus is specifically SPY and QQQ options: market structure, options chains, technical analysis, trade planning, and risk management, taught in live market conditions rather than through static, theoretical examples.
That distinction matters. Traders who learn to build and stress-test a live setup, rather than just receive an entry and exit, tend to develop judgment that holds up when the market doesn’t behave the way the textbook example did. What sets the approach apart:
- SPY and QQQ specialization instead of a generic options curriculum
- Practical education built around real trading conditions
- Structured risk management and defined trade planning
- Options-chain and price-action concepts that complement flow analysis
- Trader support and mentorship for interpreting live setups as they happen
The goal isn’t to hand traders a signal to follow — it’s independence: understand the setup, weigh the evidence, manage the risk, and make the call yourself.
FAQs
What is unusual options activity?
Unusual options activity is trading that stands out from a contract’s normal behavior — through unusually high volume, an elevated volume-to-open-interest ratio, large premiums, sweep orders, block trades, or concentration around specific strikes and expirations. It flags contracts worth investigating; it doesn’t predict where price goes next.
How do you identify unusual options activity?
Look for volume that’s unusually high relative to open interest or the contract’s typical activity, along with large premiums, repeated sweeps, block trades, aggressive executions, or unusual concentration at certain strikes or expirations. Always weigh those signals against the underlying’s current price action and broader market conditions.
Is unusual options activity bullish or bearish?
It can be either, or neutral, depending on the trade. Heavy call activity can look bullish and heavy put activity can look bearish, but both can just as easily be sold, hedged, rolled, or built into spreads — which is why direction shouldn’t be assumed from calls or puts alone.
Can unusual options activity be used for SPY and QQQ trading?
Yes. It can help identify contracts, strikes, and expirations attracting extra attention. For SPY, weigh broad-market and macro conditions; for QQQ, Nasdaq-100 momentum and tech-sector catalysts add useful context. UOA is most useful when it confirms what price is already showing.
Is unusual options activity a reliable standalone trading signal?
It’s better treated as a research and confirmation tool than a standalone signal. A large trade can represent speculation, hedging, a roll, or spread construction. Pair UOA with price action, technical levels, implied volatility, known catalysts, and a defined risk plan before entering anything.