myspyoptions.com

Categories
Options Trading

Rho Options Explained: The Most Ignored Options Greek

When considering options, investors analyze Greeks such as Delta, Gamma, Theta, and Vega. However, there is another Greek that can have a strong impact on the price of the option depending on interest rate changes: Rho.

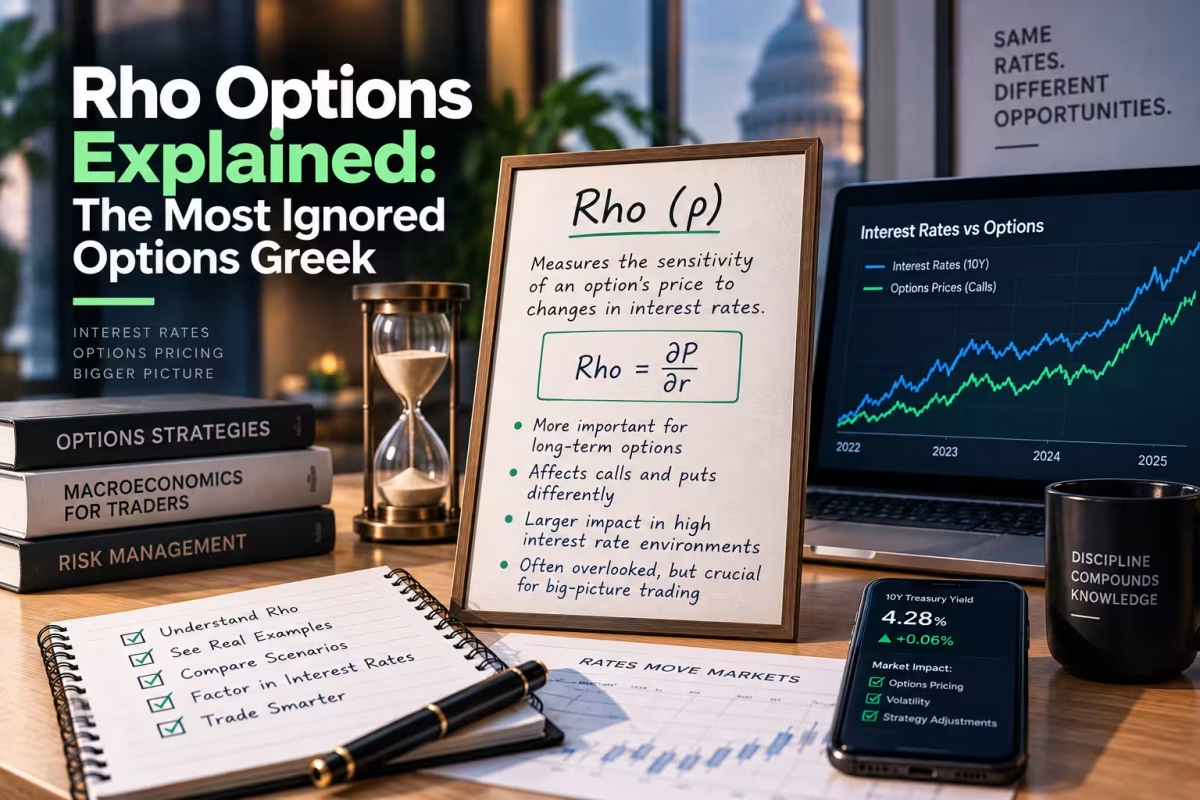
Rho shows how sensitive the price of an option is to changes in the risk-free interest rate. Its effect becomes visible when time to expiration is large. Thus, knowing Rho allows assessing the position better under changed monetary conditions. In this article, we will look into Rho options, how Rho works, and why it is important for various options strategies.

What is Rho?

Rho is the measure that shows how much the theoretical price of an option may change in case of a 1% change in the risk-free interest rate. It isolates the effect of interest rates while assuming other pricing factors remain unchanged.

For example, if the Rho of an option is 0.30, its price will theoretically increase by $0.30 per share in case of a 1% increase in the risk-free interest rate and will fall by this amount in case of a 1% decrease.

The risk-free rate usually refers to government securities and, specifically, to Treasury rates in the United States. Traders can also take into account the interest-rate situation in the country when assessing longer-term positions.

Rho is often ignored since interest rate changes usually influence the price of an option less than changes in the price of the underlying asset or in the implied volatility. However, this does not mean that it is not important.

Why is Rho Called the Most Overlooked Options Greek?

The reason Rho is usually ignored is that many retail options trades have short expiration dates. Weekly and short-dated options have low interest rate exposure.

Meanwhile, longer-dated options have more exposure to the effects of financing and discounting, as the process takes more time. Therefore, even a minor change in the interest rate may become more important in the long term.

That is why Rho options are important when:

  •       Interest rates change fast
  •       Monetary policy of the Central Bank changes
  •       Traders hold long-dated options
  •       The positions are based on substantial capital
  •       Investors trade with the help of LEAPS and other long-term options
  •       Interest-rate expectations have a great influence on market sentiment

It is important to keep in mind that Rho is not always equally important in every trade. Its importance largely depends on the expiration, type of option, moneyness, and the rate situation.

How Does Rho Affect Calls and Puts?

There is an important difference between the Rho of calls and the Rho of puts. Call options usually have positive Rho. When interest rates increase, the theoretical value of a long call will grow if other factors remain the same. The increased rates decrease the present value of the strike price to be paid in the future.

Meanwhile, put options usually have negative Rho. When interest rates increase, the theoretical value of a long put will decrease. The opposite effect will occur in the case of decreasing rates.

For example, a call with a Rho of 0.25 could theoretically gain $0.25 per share from a 1 percentage-point increase in the relevant interest rate. A put with a Rho of -0.25 could theoretically lose $0.25 per share under the same assumption. These figures show the sensitivity but not guaranteed changes in the market price.

The Effect of Time to Expiration on Rho

Time to expiration is one of the main factors that determine Rho sensitivity. An option with expiration in several days has not much time left for interest-rate changes to have an influence on it.

Meanwhile, options with expiration in several months or in years have much more time for the influence. That is why longer-dated options usually have greater Rho. This effect is particularly important for LEAPS.

Traders who hold long-term calls or puts cannot ignore Rho because it may mean ignoring some part of the interest-rate exposure of the position. While under stable interest-rate conditions the effect may be modest, it can become much more important in case of monetary policy changes.

How Does Moneyness Influence Rho?

Rho options also vary according to an option’s moneyness. The relationship between moneyness and Rho can help explain how interest rates affect options differently, as discussed below.

In-the-money options

ITM options usually have greater Rho sensitivity than OTM options. Their intrinsic value and increased probability of exercising can make interest rate changes more important.

So, a deeply in-the-money call can react more strongly to changes in interest rates than a comparable out-of-the-money call.

At-the-money options

ATM options usually lie between ITM and OTM options regarding Rho sensitivity. Pricing of ATM options includes both intrinsic and time value, among other factors such as volatility.

Rho remains important, especially for options with longer expiries.

Out-of-the-money options

OTM options usually have lower Rho sensitivity. They depend heavily on time to expiration and volatility rather than on intrinsic value.

Nevertheless, even low sensitivity does not equal zero sensitivity. Large positions and longer expirations can make the effect worth monitoring.

A Simple Rho Options Example

Suppose a call option is priced at $10 with the relevant risk-free interest rate of 5%.

Suppose the rate rises to 6%, while other pricing variables remain unchanged. If the theoretical value increases to $10.50, then the price moves by $0.50 per share for a 1 percentage-point change in the interest rate.

Hence:

  • Rho (per share) = Change in option value ÷ Change in interest rate
  • Rho (per share) = $0.50 ÷ 1 percentage point = $0.50 per 1% rate change

With a standard 100-share contract multiplier, that translates to $0.50 × 100 = $50 in theoretical dollar value per contract, for each 1 percentage-point move in interest rates.

This example ignores the complex process of actual pricing. Actual prices are influenced not only by the risk-free interest rate but also by other factors, such as the price of the underlying asset, volatility, time decay, dividends, liquidity, and other factors.

How to Calculate Rho

Rho is a partial sensitivity of an option’s value to the risk-free interest rate. It is represented as follows:

ρ = ∂V / ∂r

Where:

  •       V is the option’s value
  •       r is the interest rate
  •       ρ is the sensitivity of option value to the interest rate

There are more complicated equations used in professional pricing models. According to the Black-Scholes model, Rho depends on factors such as strike price, time to expiration, volatility, and the ratio between the price of the underlying asset and the strike.

Usually, traders do not calculate Rho options themselves, options trading and analytics software provides this measure.

How Can Rho Be Used for Trading in Options Strategies?

Rho can be of significant help in the context of a whole risk-assessment system, but not in isolation. Below are some practical ways traders can use Rho across different options strategies.

  1. Assessment of Long-Dated Positions

If the trader holds a long-dated call or put, they can monitor Rho together with Delta, Vega, and Theta, giving a full picture of the position’s sensitivities.

  1. Assess Interest-Rate Scenarios

When monetary policy is expected to change, Rho helps estimate the direction of possible interest-rate exposure of the option.

In the case of positive Rho, the long call benefits from an interest-rate increase, while the opposite happens with the long put.

  1. Comparison of Different Expirations

When comparing two options with otherwise equal factors, Rho shows how much additional interest-rate exposure comes from choosing a longer expiration.

This approach is particularly useful when deciding between short-term and long-term options.

  1. Construction of Portfolio Hedges

Portfolio managers can consider Rho while building hedges using long-term options. Factoring in Rho can help surface exposures that other Greeks don’t capture.

  1. Combining Rho with Other Greeks

Each Greek considers a different aspect of an option’s risk.

Delta shows sensitivity to changes in the price of the underlying asset; Gamma shows changes in Delta; Theta shows the effect of time decay; Vega shows sensitivity to changes in implied volatility; and Rho shows interest-rate sensitivity.

When Should Traders Pay More Attention to Rho?

While long expiration and changing interest rates usually make Rho more important, traders should also take into account expiration, position size, and other market factors. The following situations can make Rho more relevant:

  •   Long-dated options can have greater sensitivity to interest-rate changes.
  •       Changing interest rates can increase the practical importance of Rho.
  •       Major central bank decisions may affect options with higher Rho exposure.
  •       Large positions can make small Rho changes more financially significant.
  •       LEAPS and other long-term strategies may require closer attention to Rho.
  •       Interest-rate-sensitive assets can make Rho more relevant to a trading strategy.
  •       Portfolio risk management can benefit from understanding overall Rho exposure.
  •       Short-term options may require less attention to Rho when rates remain stable.

Therefore, traders should focus on situations where interest-rate exposure could materially affect the position.

Rho vs Other Options Greeks

The table below compares the primary sensitivity of each Greek and the situations in which it becomes more relevant.

Greek Primary Sensitivity Generally More Relevant When
Delta Underlying price The underlying moves
Gamma Change in Delta Positions approach expiration
Theta Time decay Time passes
Vega Implied volatility Volatility changes
Rho Interest rates Rates and longer expirations matter


This comparison shows why Rho can remain hidden in short-term trading. Other Greeks often create larger day-to-day price effects. Still, Rho completes the broader picture of option-price sensitivity.

Conclusion

Although Rho is not as popular as other Greeks, it can reveal important interest-rate exposure. Its importance increases with long-dated options and changing monetary conditions. Knowing Rho options can help traders evaluate risks that may go unnoticed without considering Delta, Theta, Gamma, and Vega.

For actionable options education, market perspectives, and trading insights, visit MySPYOptions to strengthen your options knowledge and decision-making.

FAQs

  1. What does Rho mean in options trading?

Rho is the measure that shows how much the theoretical price of an option may change for a 1% change in the risk-free interest rate.

  1. Is Rho positive for call options?

Yes, call options generally have positive Rho, meaning the theoretical price of a call tends to increase as interest rates rise.

  1. Which options are most affected by Rho?

Long-dated options, particularly ITM contracts, generally show greater Rho sensitivity than short-dated or OTM options.

  1. Should traders use Rho alone when making decisions?

No, Rho should be considered alongside Delta, Gamma, Theta, Vega, expiration, moneyness, and broader market conditions.
 

Categories
Finance Options Trading

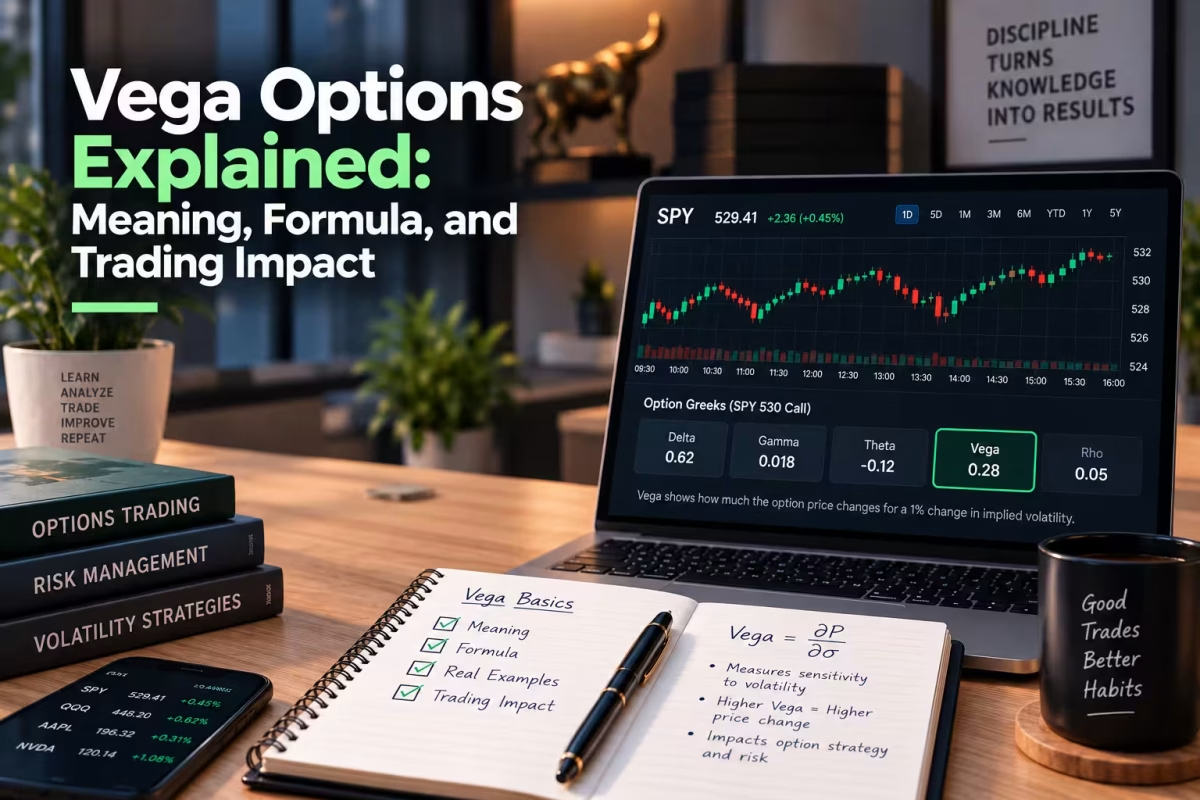
Vega Options Explained: Meaning, Formula, and Trading Impact

Vega options measure how sensitive an option’s premium is to shifts in implied volatility. An option’s price can change even when the underlying asset barely moves. The main driver behind that kind of move is implied volatility, the market’s forward-looking estimate of how much an asset’s price could swing. Vega is used to calculate how sensitive the option price is to a change in volatility. Understanding vega options helps traders weigh volatility risk before opening a position, rather than after. 

In this article, we will explain what vega options are, their formula, practical applications, and common trading mistakes to avoid. Read on for a detailed analysis!

What is Vega in Options?

Vega is an option Greek that measures the sensitivity of an option premium to the change in implied volatility. In simple terms: Vega tells you how much an option’s price is expected to move for every 1 percentage-point change in implied volatility, all else held equal. 

If Vega equals $0.60, this means that the option premium is expected to grow (decline) by approximately $0.60 if the implied volatility grew (declined) by 1 percentage point. Vega is applicable to both calls and puts, though its effect depends on the type of position opened. Vega is usually higher for at-the-money options and longer-dated options.

How Does Vega Impact Option Prices?

Implied volatility directly impacts the extrinsic value of an option. When there is an expected increase in volatility, premiums are likely to rise, while a decrease in volatility may lower premiums.

Long call and put options usually have positive Vega, meaning increased volatility is beneficial for them. Short options, on the other hand, normally have negative Vega, meaning they react negatively to increased volatility. Longer-dated options are more sensitive to volatility shifts than shorter-dated ones.

Vega does not measure volatility itself; it measures sensitivity to it.

Vega Options Formula (How to Calculate Vega)

The standard Black-Scholes model offers a mathematical approach to calculating Vega. The formula is:

Vega = S × φ(d₁) × √T

Where:

  •       S is the price of the underlying asset
  •       φ(d₁) is the standard normal probability density function at the point d₁
  •       T is the time remaining until the option’s maturity, in years
  •       d₁ is a function of the underlying asset price, strike price, volatility, interest rate, and time to expiration

This equation estimates the impact of implied volatility changes on an option’s theoretical value. Since market quotes are given in percentages, traders typically interpret Vega relative to a 1% change in implied volatility.

The precise calculation depends on the pricing model and contract specifications, so traders generally rely on the Vega figure provided by their trading platform rather than calculating it manually for every position.

Vega Options Example

An example helps clarify the concept. Assume a call option costs $12, with implied volatility of 20% and a Vega of $0.80.

If implied volatility rises from 20% to 21%, the estimated premium change would be:

$0.80 × 1 = $0.80

In this case, the option premium would move from $12 to $12.80, assuming all other factors stay constant.

Conversely, if implied volatility falls from 20% to 19%, the estimated premium would drop to $11.20.

This is an estimate, not a guarantee. The price of the underlying asset, time value, interest rates, and other Greeks can shift simultaneously, so the actual premium move will likely differ from what Vega alone suggests.

How Traders Can Use Vega

Vega gives traders a way to assess how sensitive their options position is to changes in implied volatility. It can help in choosing better contracts and building appropriate trade plans. Common uses include:

Assessing Volatility Exposure

This shows whether a position has positive or negative exposure to implied volatility. A positive-Vega position benefits from rising implied volatility, while a negative-Vega position can benefit from falling implied volatility.

Comparing Option Contracts

Traders can compare Vega across strikes and expiration dates to identify contracts with higher or lower volatility sensitivity.

Evaluating Volatility-Based Strategies

Traders anticipating changes in implied volatility can use Vega to gauge premium sensitivity — useful for volatility-focused strategies that don’t depend on price direction.

Managing Multi-Leg Positions

Vega can be summed across individual legs to evaluate the volatility exposure of a multi-leg strategy. For example, a position with +0.50 Vega combined with one at -0.30 Vega nets to approximately +0.20 Vega.

Monitoring Portfolio Risk

Tracking total portfolio Vega helps traders understand how the whole book reacts to volatility shifts. A portfolio with high positive or negative Vega can see substantial value changes when implied volatility moves.

Relationship Between Vega and Options Strategies

The table below shows the relationship between Vega and common options strategies:

Options Strategy Typical Vega Exposure Impact of Rising Implied Volatility
Long Call Positive Generally beneficial
Long Put Positive Generally beneficial
Short Call Negative Generally unfavorable
Short Put Negative Generally unfavorable
Long Straddle Strong Positive Generally beneficial
Long Strangle Positive Generally beneficial
Short Straddle Strong Negative Generally unfavorable
Short Strangle Negative Generally unfavorable


Actual Vega exposure will vary depending on strikes, expirations, and other contract characteristics.

Mistakes to Avoid When Trading Vega Options

Vega offers valuable information, but it shouldn’t be analyzed in isolation. Traders often misjudge an option’s risk by focusing on a single Greek while ignoring the broader pricing picture. Common mistakes include:

  •       Confusing Vega with volatility: Vega indicates sensitivity to implied volatility — it isn’t the volatility figure itself.
  •       Ignoring the underlying price: An option’s premium can shift from implied volatility alone, even if the underlying asset isn’t moving.
  •       Treating Vega as a guarantee: Vega assumes every other input stays constant, which rarely holds true in live markets.
  •       Overlooking portfolio-level Vega: Individual positions may show small Vega values, but combined across a portfolio, the exposure can become significant.

Delta, Gamma, Theta, implied volatility, and underlying price should all be considered alongside Vega, not in place of it.

Conclusion

Vega shows how changes in implied volatility can affect option prices. Its significance grows with time to expiration and with higher sensitivity to volatility shifts. Analyzing the Vega of each trade and strategy can help surface potential risks, but vega options analysis should be one part of a broader options analysis, not a standalone signal.

If you want to sharpen your options knowledge with actionable insights, market perspective, and educational resources, visit MySPYOptions for options trading education and market insight.

FAQs

  1. What is Vega in options?

Vega shows how much an option’s premium may change for every 1 percentage-point move in implied volatility, assuming other factors stay constant. The higher the Vega, the more sensitive the option is to implied volatility changes.

  1. Is higher Vega good for options traders?

Not always. High Vega can benefit traders holding long option positions when implied volatility rises, but it can also raise risk if implied volatility falls. It depends on the trader’s position and outlook.

  1. Is Vega positive for calls and puts?

Yes, Vega is positive for both long call and long put positions. Their premiums rise with increasing implied volatility and fall as implied volatility declines.

  1. What happens to Vega when implied volatility rises?

Premiums on long options tend to increase. However, Vega itself can shift with market conditions, moneyness, and time to expiration, so it shouldn’t be treated as a fixed number.

  1. Which options have the highest Vega?

At-the-money options typically carry the highest Vega. Longer-dated options also tend to have higher Vega, since there’s more time for volatility changes to affect the premium.

  1. What’s the difference between Vega and Delta?

Delta measures sensitivity to the underlying asset’s price movement, while Vega measures sensitivity to implied volatility changes. Together, they help traders assess different dimensions of options risk.


Categories
Finance Options Trading

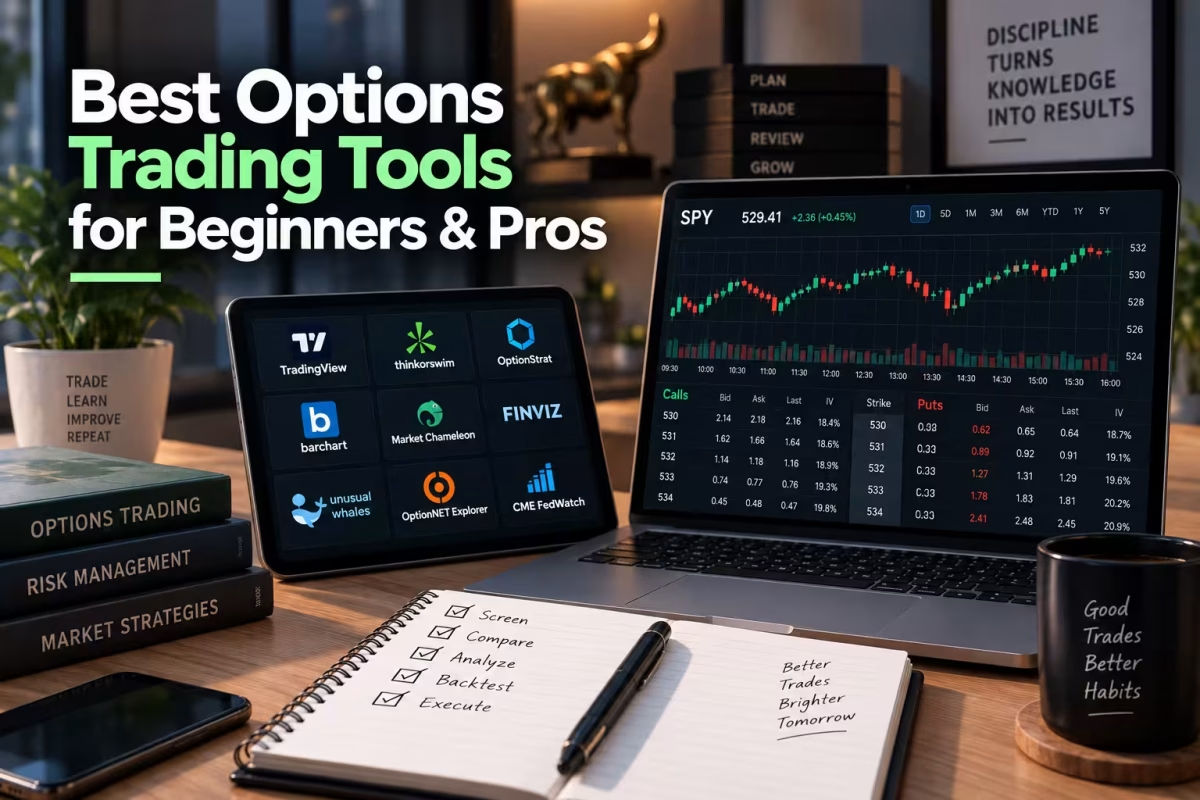
Best Options Trading Tools for Beginners & Pros

The right options trading tools depend less on your experience level and more on which job you’re trying to do — placing trades, finding candidates, sizing risk, or reviewing what worked. Most “best tools” roundups mix brokers, screeners, and calculators into one undifferentiated list, which leaves beginners overwhelmed and pros without a clear upgrade path.

This guide organizes options trading tools by the actual job they solve, gives you a decision matrix for building a stack that matches your experience level, and shows what a minimal, practical toolkit looks like if your focus is SPY and QQQ rather than the entire market.

What Counts as an Options Trading Tool?

In short: An options trading tool is any software that helps you find, analyze, size, execute, or review an options trade. That spans five distinct jobs — execution, discovery, analysis, risk sizing, and review — and no single platform does all five equally well.

Most traders start with just a broker’s built-in platform and gradually add specialized tools as their strategies get more specific. The mistake isn’t using a broker platform alone; it’s assuming that one tool covers every job in the process.

The 5 Categories of Options Trading Tools You Actually Need

Bottom line: Every options trading tool on the market fits into one of five jobs — execution, discovery, analysis, risk management, or performance review. Knowing which job a tool solves prevents you from paying for overlapping features or missing a category entirely.

Category Job It Solves Common Examples
Execution platforms Placing and managing trades thinkorswim, tastytrade, Interactive Brokers, Fidelity
Discovery tools (screeners/scanners) Finding contracts or setups matching your criteria Broker-built screeners, Barchart, dedicated flow scanners
Analysis tools Modeling payoff diagrams, Greeks, and probability OptionStrat, platform-native P/L visualizers
Risk & position sizing tools Calculating position size, Stop-Loss levels, and Risk-to-Reward Ratio Broker margin calculators, spreadsheet models
Performance review tools Journaling trades and analyzing what worked Trade journal software, broker trade history exports

Key takeaway: A complete toolkit touches all five categories. Most beginners over-invest in execution platform features (chasing the “best broker”) while skipping performance review entirely — and review is often what separates a trader who improves from one who repeats the same mistakes for years.

Building Your Tool Stack: A Decision Matrix by Experience Level

Rather than adopting every tool a “best of 2026” list recommends, match your stack to your actual stage. Adding pro-level complexity too early usually slows a beginner down; staying with beginner tools too long caps a pro’s edge.

Stage Execution Discovery Analysis Risk Sizing Review
Beginner Broker’s standard platform with paper trading Broker’s built-in screener only Broker’s native payoff diagram tool Simple percentage-of-account rule Manual notes after each trade
Intermediate Broker platform + real-time Greeks Broker screener + one dedicated free tool (e.g., Barchart) Dedicated payoff visualizer (e.g., OptionStrat) Spreadsheet-based position sizing model Basic trade journal software
Pro / Active Platform with advanced order types and multi-leg execution Real-time flow scanner + custom saved screens Multi-leg strategy builder with IV Rank overlays Automated risk dashboards, portfolio-level Greeks Structured journal with tagged strategy performance

In short: Progression through this matrix should follow your strategy complexity, not your account size. A trader running the same covered call strategy for three years doesn’t need pro-tier discovery tools just because their account has grown — but a beginner running multi-leg iron condors from day one is already under-tooled with beginner-stage discovery alone.

Comparing Popular Options Trading Tools by Category

Here’s how well-known tools map onto the five categories above. This isn’t a ranked “best overall” list — the right fit depends on your stage and strategy, not a single winner.

  • thinkorswim (Schwab) — Execution and analysis. Strong native Option Hacker screener, paper trading, and a deep glossary linked directly to live metrics like Implied Volatility and the options Greeks.
  • tastytrade — Execution and discovery. Built around options-first workflows with an integrated screener and embedded educational context on the trade ticket itself.
  • Interactive Brokers — Execution for advanced traders. Offers a Probability Lab and Volatility Lab for traders who need institutional-grade analytics alongside global market access.
  • Barchart — Discovery. A free, web-based screener useful for beginners learning which filters (Open Interest, Volume, Implied Volatility) matter before committing to a paid tool.
  • OptionStrat — Analysis. Purpose-built for visualizing payoff diagrams and probability of profit across single- and multi-leg strategies before risking capital.
  • Dedicated flow/scanner platforms — Discovery, for pros specifically watching unusual options activity as a directional signal rather than filtering by fixed criteria.

Bottom line: No single platform excels at all five jobs. Most experienced traders run two or three tools together — one for execution, one for discovery, and a lightweight review process — rather than searching for one app that does everything.

A Minimal SPY & QQQ Tool Stack

Most tool roundups are built for traders scanning the entire market across thousands of tickers. If your focus is exclusively SPY and QQQ, a much smaller stack does the job — and paying for whole-market breadth is often wasted spend.

Practical workflow for a SPY/QQQ-focused trader:

  1. Execution: A broker with real-time Greeks and paper trading for practice (thinkorswim or tastytrade both work well here).
  2. Discovery: A single saved screen per ticker, since the Invesco QQQ Trust (QQQ) and SPDR S&P 500 ETF Trust (SPY) carry different baseline Implied Volatility profiles and shouldn’t share one filter set.
  3. Analysis: A payoff visualizer to confirm max loss, max gain, and breakeven before entering any multi-leg position.
  4. Risk sizing: A simple rule — for example, capping any single position at 1-2% of account value — checked against your calculated Risk-to-Reward Ratio.
  5. Review: A basic log of entry criteria, exit reason, and outcome, reviewed weekly rather than after every single trade.

Mini example (hypothetical, for illustration only): A trader running weekly SPY put credit spreads doesn’t need a $100/month flow scanner tracking dark pool activity across the whole market. A broker’s built-in screener, one saved filter (30-45 DTE, 0.20-0.25 delta, IV Rank above 40), a free payoff calculator, and a simple spreadsheet journal cover the entire workflow at little to no added cost.

Common Mistakes When Building an Options Trading Toolkit

  1. Chasing the “best broker” instead of the right job fit. A broker with the deepest analytics is wasted on a trader who only needs basic execution and a simple screener.
  2. Skipping performance review entirely. Execution, discovery, and analysis tools get attention; almost nobody journals consistently, even though it’s often the highest-leverage habit for improvement.
  3. Scaling tool complexity with account size instead of strategy complexity. A bigger account doesn’t require pro-tier tools if the strategy hasn’t changed.
  4. Using one filter set for both SPY and QQQ. Their different volatility baselines mean a single IV threshold will misclassify one of the two.
  5. Treating a tool’s output as a finished decision. Any screener result, payoff diagram, or flow alert still needs a check against the underlying’s technical chart, Moving Averages, MACD, or VWAP before you act.

Learn to Use These Tools with Purpose: MySpyOptions

Tools organize information — they don’t teach judgment. Knowing that a broker’s screener returned a 0.20-delta SPY put, or that a payoff calculator shows a favorable Risk-to-Reward Ratio, only matters if you understand how that trade fits your broader plan and risk tolerance.

This is where MySpyOptions fits into the toolkit conversation. Rather than teaching generic options theory across every possible underlying, the platform focuses specifically on practical SPY and QQQ trading — the two most liquid, most heavily traded instruments for retail options traders — so the tools above connect directly to strategies you’ve actually studied rather than abstract examples. Structured, strategy-specific education tends to build consistency faster than assembling tools without a framework for using them.

Why Choose MySpyOptions

Buying more tools rarely fixes inconsistent trading. MySpyOptions is built around three things that actually move the needle:

  • Focused curriculum on SPY and QQQ, so lessons map directly to the minimal tool stack most retail traders actually need.
  • Practical strategy walkthroughs that connect screener output, payoff diagrams, and position sizing into one coherent process instead of disconnected tools.
  • Trader support from experienced traders and a community reviewing the same setups — without exaggerated promises about tools or performance.

The goal is turning a pile of tools into a repeatable process.

Key Takeaways

  • Options trading tools fall into five jobs: execution, discovery, analysis, risk sizing, and review. A complete toolkit touches all five, not just execution.
  • Match tool complexity to your strategy’s complexity, not your account size or a generic “best of 2026” ranking.
  • No single platform does all five jobs well — most traders run two or three tools together.
  • If you only trade SPY and QQQ, a minimal five-step stack usually beats an expensive, whole-market platform.
  • Tools organize information; they don’t replace risk management, chart review, or a structured process for interpreting what they show you.

Frequently Asked Questions

What are the most important options trading tools for beginners? Beginners generally need just three things to start: a broker platform with paper trading, that broker’s built-in screener, and a simple risk-sizing rule like capping any position at 1-2% of account value. More advanced tools can wait until strategy complexity actually requires them.

Do I need a paid options trading platform, or is a free one enough? For most retail traders, a broker’s free, built-in tools (screener, payoff diagrams, paper trading) cover execution, discovery, and analysis. Paid, dedicated tools become worthwhile once your strategy specifically requires features your broker doesn’t offer, like real-time flow data or advanced portfolio-level Greeks.

What’s the difference between an options screener and a trading platform? A trading platform executes and manages trades; a screener filters the options chain by criteria like delta, implied volatility, and open interest to help you find candidates before you trade. Many platforms include a basic screener, but dedicated screening tools often add deeper filters.

Should I use the same tools for SPY and QQQ that I’d use for individual stocks? Not entirely. SPY and QQQ have different baseline Implied Volatility and are driven more by macro events than single-company earnings, so a screener calibrated for individual-stock earnings proximity is less useful here than one accounting for Federal Reserve announcements and broad market catalysts.

Why is trade journaling considered a trading tool? Because performance review is one of the five core jobs any complete toolkit needs to cover. Reviewing entry criteria, exit reasoning, and outcomes systematically is often what separates traders who improve over time from those who repeat the same mistakes.

Can I trade options successfully with just a broker’s built-in tools? Yes, for many strategies. A broker’s native screener, payoff visualizer, and paper trading account cover the essential execution, discovery, and analysis jobs. Dedicated third-party tools add depth but aren’t required to start trading responsibly.


Categories
Options Trading

Best Options Scanners for Traders

An options scanner is a tool that continuously monitors the options market and flags contracts or activity matching specific conditions — unusual volume, large block trades, elevated implied volatility, or a set of custom filters you define. The “best” one isn’t universal; it depends on whether you’re hunting for trade ideas, tracking institutional flow, or screening SPY and QQQ contracts against your own strategy rules.

Most roundups treat “options scanner” as one category and rank a single winner. That’s misleading. A scanner built to detect unusual options activity solves a completely different problem than one built to filter contracts by delta and open interest, and using the wrong type for your strategy wastes both time and money.

This guide breaks scanners into their real categories, gives you a vendor-neutral framework for evaluating any tool, and covers what actually matters if your focus is SPY and QQQ rather than scanning the entire market.

What Is an Options Scanner, and How Is It Different From a Screener?

In short: An options scanner actively monitors the market in real time and alerts you when something matches your criteria as it happens. An options screener is typically a static, on-demand filter you run manually against current data. In practice, most platforms blend both, but the distinction matters when you’re choosing a tool.

Options Scanner Options Screener
Mode Continuous, real-time monitoring On-demand, run-when-you-want
Typical use case Catching unusual volume or flow as it develops Filtering the full chain by delta, IV, or OI at a point in time
Best for Traders reacting to intraday signals Traders building positions around planned criteria
Example Unusual options activity alert on a sweep order A saved filter for 30-45 DTE puts under 0.25 delta

Neither is objectively better — they answer different questions. A screener answers “which contracts fit my plan right now?” A scanner answers “what’s happening in the market that I should know about?”

The 3 Types of Options Scanners

Bottom line: Nearly every tool on the market falls into one of three categories — criteria-based screening scanners, unusual-activity/flow scanners, or alert-based watchlist scanners. Knowing which category solves your actual problem prevents you from paying for features you’ll never use.

  1. Criteria-based scanners. Filter the options chain by Delta, Theta, Gamma, Vega, Implied Volatility, IV Rank, Open Interest, and Days to Expiration (DTE). Thinkorswim’s Option Hacker, tastytrade’s screener, and Barchart’s free options screener fall here. Best for traders who already know their strategy and just need to find matching contracts.
  2. Unusual activity / flow scanners. Track large or atypical trades — sweep orders, block trades, and volume that significantly exceeds open interest — as a signal of possible institutional positioning. Tools like Unusual Whales and similar flow platforms specialize in this. Best for traders looking for directional ideas rather than filtering their own predefined setups.
  3. Alert-based watchlist scanners. Monitor a fixed list of tickers (like just SPY and QQQ) and push notifications when a condition triggers — an IV spike, a volume surge, or a technical level being hit. Best for traders who don’t want to sit at a screen all day.

Key takeaway: If you already know you want a 0.20-delta put spread on SPY, you need a criteria-based screener, not a flow scanner. If you’re trying to spot where large capital is positioning before you have a thesis, a flow scanner fits better. Buying the wrong category is the single most common reason traders feel a scanner “isn’t working.”

A Framework for Evaluating Any Options Scanner

Rather than chasing whichever tool ranks #1 on a given list, run every scanner through this five-point rubric before subscribing. It’s built to be vendor-neutral, since accuracy and “win rate” claims from any single provider should be treated as marketing until you’ve verified them yourself.

The D-L-A-C-C Scanner Evaluation Framework:

  1. Data quality. Is pricing real-time, or delayed 15-20 minutes? Delayed data is a dealbreaker for 0DTE or fast intraday strategies.
  2. Liquidity filters. Can you filter by Open Interest and bid-ask spread, not just volume? A signal on an illiquid contract isn’t tradeable.
  3. Alerting. Does it push notifications, or do you have to keep the tab open? Passive monitoring only works if it actually alerts you.
  4. Customization. Can you save specific screens for SPY and QQQ separately, given their different baseline Implied Volatility and sector exposure?
  5. Cost-to-usage fit. Does the subscription price match how often you’ll actually use it? A $100/month flow scanner is wasted on someone placing two trades a week.

Score each tool 1-5 on these five criteria before comparing price. A cheap tool that fails on data quality is more expensive in missed or bad fills than a pricier one that’s accurate.

Comparing Options Scanner Categories: What You Get at Each Price Point

Category Typical Cost Real-Time Data Best Fit
Broker-built screeners (thinkorswim, tastytrade) Free with account Usually real-time for account holders Traders who already have a brokerage relationship and want basic filtering
Free web screeners (Barchart, etc.) Free Often delayed 15-20 min Beginners learning what filters exist before paying for anything
Dedicated flow/unusual activity platforms $20-$100+/month Real-time Traders seeking directional ideas from institutional activity
Comprehensive analytics platforms (Market Chameleon and similar) $30-$100+/month Real-time Traders who want deep IV Rank, earnings, and cross-underlying analytics in one place

In short: You don’t need to pay for real-time flow data if you’re screening 30-45 DTE credit spreads on SPY once a week — that’s a criteria-based use case a free or broker-built screener handles fine. Flow and alert tools earn their subscription cost only when your strategy actually depends on reacting to intraday signals.

Choosing a Scanner When You Only Trade SPY and QQQ

Most scanner roundups are built for traders scanning the entire market — thousands of tickers, sector rotation, small-cap unusual activity. If your focus is exclusively SPY and QQQ, you don’t need that breadth, and paying for it is a wasted feature.

What actually matters for SPY/QQQ-focused scanning:

  • Separate volatility baselines. The Invesco QQQ Trust (QQQ) tracks the NASDAQ-100 Index and runs a generally higher baseline Implied Volatility than the SPDR S&P 500 ETF Trust (SPY), which tracks the broader, more diversified S&P 500. A scanner that applies one flat IV threshold to both will misfire on one of them.
  • Macro-event awareness over single-stock earnings. SPY and QQQ move on Federal Reserve announcements, CPI releases, and broad market sentiment more than any single company’s earnings report — a scanner with economic calendar integration matters more here than an earnings-proximity filter built for individual stocks.
  • Liquidity is rarely the constraint. Both SPY and QQQ options carry deep Open Interest and tight spreads across most strikes, so a scanner’s liquidity filters matter less here than they would scanning thinly traded small-caps.

Mini example (hypothetical, for illustration only): A trader running weekly QQQ iron condors doesn’t need a flow scanner tracking dark pool prints across 3,000 tickers. A simple, saved criteria screen — IV Rank above 50, 7-10 DTE, short strikes at 0.15-0.20 delta — run once a week against just QQQ accomplishes the entire job a $100/month platform would, at a fraction of the cost.

Common Mistakes When Choosing an Options Scanner

  1. Paying for flow data you don’t act on. If you never trade off unusual activity alerts, that feature isn’t earning its subscription cost.
  2. Ignoring data delay. A scanner with 15-minute-delayed data can materially mislead a 0DTE or fast-moving strategy.
  3. Trusting unverified “accuracy” claims. Any single vendor’s self-reported win rate or accuracy percentage should be treated as a marketing claim, not independent research, until verified.
  4. Scanning the whole market when you only trade two tickers. Broad-market scanners add noise and cost when your strategy is SPY/QQQ-specific.
  5. Using scanner output as a finished decision. A flagged contract or unusual trade still needs review against the chart, Relative Strength Index (RSI), Moving Averages, and your own Risk-to-Reward Ratio before you act.

Learn to Use Scanners the Right Way with MySpyOptions

A scanner surfaces candidates — it doesn’t teach you what to do with them. Knowing that QQQ just showed unusual call volume, or that a SPY put spread cleared your delta filter, is only useful if you understand how that fits your broader plan, your position sizing, and your risk tolerance.

That’s the gap MySpyOptions focuses on closing. Rather than covering the entire options universe, the platform teaches practical SPY and QQQ trading specifically — the two most liquid, most heavily traded underlyings among retail options traders — so scanner output connects directly to strategies you’ve actually studied. Structured, strategy-specific education tends to build consistency faster than piecing together scanner alerts without a framework for interpreting them.

Why Choose MySpyOptions

Turning a scanner alert into a well-reasoned trade takes more than access to data. MySpyOptions is built around three things that make that translation possible:

  • Focused curriculum on SPY and QQQ, so every lesson maps to the tickers you’re actually scanning.
  • Practical strategy walkthroughs that connect scanner signals (IV Rank, Delta, unusual volume) to real trade construction, position sizing, and Stop-Loss placement.
  • Trader support from experienced traders and a community working through the same setups — without exaggerated performance promises.

The goal is turning “the scanner flagged this” into “I understand why this fits my plan.”

Key Takeaways

  • An options scanner monitors the market in real time for matching activity; a screener is typically an on-demand filter — most platforms blend both.
  • Scanners fall into three categories: criteria-based, unusual-activity/flow, and alert-based watchlist tools. Matching the category to your actual strategy matters more than picking a single “best” tool.
  • Use the D-L-A-C-C framework (Data quality, Liquidity filters, Alerting, Customization, Cost-to-usage fit) to evaluate any scanner before subscribing.
  • If you only trade SPY and QQQ, you rarely need whole-market breadth — a simple, saved criteria screen calibrated to each ticker’s own volatility baseline usually beats a broad, expensive platform.
  • A scanner narrows your search. It doesn’t replace chart review, risk management, or verifying vendor claims independently.

Frequently Asked Questions

What’s the difference between an options scanner and an options screener?
A scanner typically monitors the market continuously and alerts you to matching activity in real time. A screener is usually a filter you run on demand against current data. Many platforms combine both functions under one name.

Do I need a paid options scanner, or is a free one enough?
It depends on your strategy. If you’re screening criteria like delta and open interest on SPY and QQQ a few times a week, a free or broker-built screener is usually sufficient. Paid flow scanners earn their cost only if your strategy depends on reacting to real-time unusual activity.

What is an unusual options activity scanner used for?
It flags large or atypical trades — sweep orders, block trades, or volume that significantly exceeds open interest — as a possible signal of institutional positioning, giving traders a directional idea to investigate further rather than a finished trade.

Should I use the same scanner settings for SPY and QQQ?
No. QQQ tracks the NASDAQ-100 Index and typically carries a higher baseline Implied Volatility than SPY, which tracks the broader S&P 500. A flat volatility threshold calibrated to one will often misclassify normal conditions on the other.

Can an options scanner guarantee accurate trade signals?
No. Any scanner’s flagged activity still requires independent verification against price action, technical indicators, and your own risk tolerance. Self-reported accuracy statistics from a single vendor should be treated as marketing claims, not verified research, unless independently confirmed.

What should beginners look for in their first options scanner?
Beginners generally do best starting with a free, broker-built criteria screener (like thinkorswim’s Option Hacker or a similar tool) to learn which filters matter — delta, IV Rank, open interest — before paying for a real-time flow or alert platform.


Categories
Options Trading

What is an Options Screener & How to Use It

An options screener is a filtering tool that scans thousands of live options contracts and narrows them down to the handful that match criteria you set — things like delta, implied volatility, open interest, and days to expiration. Instead of scrolling through a bloated options chain one strike at a time, you tell the screener what a “good” trade looks like, and it hands you a short, rankable list.

For SPY and QQQ traders specifically, this matters more than for random small-cap tickers. Both symbols have thousands of active strikes across dozens of weekly and monthly expirations — finding a 0.20-delta put 35 days out with tight spreads means clicking through a chain that can run 300+ rows deep. A screener does that in seconds.

This guide covers how options screeners work, which filters actually move the needle, a step-by-step framework for using one, and where SPY and QQQ screening diverges from screening individual stocks.

What Is an Options Screener, Exactly?

In short: An options screener is a search-and-filter engine for the options market. You input criteria — strike, expiration, delta, IV rank, volume — and it returns only the contracts that satisfy every condition, ranked however you choose.

Think of it as a search engine, but for derivatives instead of web pages. Google filters billions of pages down to ten results based on relevance. An options screener filters a market with well over a million listed contracts down to a shortlist you can actually evaluate by hand.

The core inputs behind almost every options screener are the same:

  • Underlying and strategy type — single-leg calls/puts, spreads, or multi-leg structures
  • Expiration window — 0DTE, weekly, 30-45 days to expiration (DTE), or LEAPS
  • Strike selection — in-the-money, at-the-money, or out-of-the-money
  • The Greeks — Delta, Theta, Gamma, and Vega
  • Volatility metrics — Implied Volatility (IV) and IV Rank
  • Liquidity metrics — Open Interest and Volume

A screener doesn’t pick trades for you. It removes the 99% of contracts that don’t fit your strategy so you can spend your research time on the 1% that might.

How Does an Options Screener Actually Work?

In short: A screener pulls live data from the options chain, applies your filters as sequential logic conditions (delta between X and Y, IV rank above Z, expiration within a window), and returns matching contracts sorted by whatever column you choose.

Under the hood, the process runs in three steps: data ingestion (pulling live or delayed pricing, Greeks, and volume/open interest across every optionable underlying or a watchlist like SPY and QQQ), filter application (each criterion acts like a database query — “Delta between 0.15 and 0.30 AND DTE between 30 and 45”), and ranking (results populate a sortable table by yield, volume, IV Rank, or risk-to-reward).

Most retail brokers offer a basic version inside their trading platform (thinkorswim’s Option Hacker and Tastytrade’s screener are common examples), while dedicated screening tools add deeper filters like earnings proximity, unusual options activity, or IV percentile ranking that broker platforms often lack.

Key Options Screener Filters You Need to Know

Not every filter matters equally. Here’s the breakdown of what consistently separates a useful screen from a noisy one.

Filter What It Measures Why It Matters
Delta Rate of option price change per $1 move in the underlying; doubles as a rough probability of expiring in-the-money Sets your directional exposure and approximate win-rate for premium-selling strategies
Theta Rate of time decay per day Sellers want higher theta; buyers want to minimize its drag
Gamma Rate of change in delta itself Critical for short-dated and 0DTE positions where delta shifts fast
Vega Sensitivity to a 1-point change in implied volatility Tells you how much a position gains or loses purely from IV expansion or contraction
Implied Volatility (IV) The market’s forward-looking estimate of price movement High IV inflates premium; screening for it helps premium sellers find “expensive” options
IV Rank / IV Percentile Where current IV sits relative to its own 52-week range Prevents you from selling “high” IV that’s actually low compared to that ticker’s history
Open Interest (OI) Total outstanding contracts at a strike Low OI often means wide spreads and difficulty exiting a position
Volume Contracts traded that session Confirms a strike is actively traded, not just theoretically listed
Days to Expiration (DTE) Time remaining until the contract expires Determines your theta decay rate and total risk exposure window
Bid-Ask Spread Difference between the buy and sell price A wide spread (often flagged as a percentage of the mid-price) increases slippage cost

Bottom line: Delta and DTE set your strategic exposure. IV and IV Rank tell you whether options are cheap or expensive. Open Interest and spread width tell you whether you can actually get filled at a fair price. Skipping the liquidity filters is the single most common screener mistake — a trade can look statistically perfect and still be untradeable if nobody else is in it.

A Step-by-Step Framework for Using an Options Screener

Rather than randomly stacking filters, run every screen through this four-layer sequence. It’s the same order professional desks tend to apply filters in, and it prevents you from optimizing for a metric (like yield) that turns out to be untradeable.

The Liquidity-Volatility-Greeks-Strategy (LVGS) Framework:

  1. Liquidity layer (filter first, always). Set minimum Open Interest (commonly 100+ contracts for SPY/QQQ strikes) and cap the bid-ask spread. This eliminates untradeable contracts before you waste time analyzing them.
  2. Volatility layer. Decide whether you want high IV Rank (favors premium-selling strategies like credit spreads and covered calls) or low IV (favors long calls, puts, or debit spreads). Set your IV Rank range accordingly.
  3. Greeks layer. Narrow by Delta to match your risk tolerance and directional view, then check Theta and Gamma to confirm the decay profile and short-term risk fit your holding period.
  4. Strategy layer. Apply the structural criteria specific to your strategy — DTE window, strike width for spreads, or earnings-date proximity — and sort the shortlist by risk-to-reward ratio.

Mini example (SPY, hypothetical, for illustration only): SPY is near $580 and you want a 30-45 DTE put credit spread. The liquidity layer leaves strikes with tight spreads and 500+ open interest. The volatility layer flags an IV Rank of 55 — tradeable for premium selling. The Greeks layer narrows you to short puts around 0.20-0.25 delta. The strategy layer ranks what’s left by risk-to-reward, leaving two or three spreads worth verifying against the chart and any upcoming Federal Open Market Committee (FOMC) dates — never traded blind off the screener alone.

This is where a screener’s real value shows up: it doesn’t replace judgment, but it stops you from manually eyeballing 40 strikes to find the two worth a second look.

Options Screener for SPY vs. QQQ: What’s Actually Different

Most screener guides treat every underlying the same way. SPY and QQQ behave differently enough that your filter settings shouldn’t be identical.

Factor SPDR S&P 500 ETF Trust (SPY) Invesco QQQ Trust (QQQ)
Underlying index S&P 500 (500 large-cap U.S. stocks across sectors) NASDAQ-100 Index (100 largest non-financial NASDAQ companies)
Sector concentration Broadly diversified across 11 sectors Heavily weighted toward technology and growth names
Typical IV behavior Generally lower baseline IV; spikes around macro events (CPI, FOMC) Generally higher baseline IV; more sensitive to mega-cap tech earnings
Dividend impact on options pricing Quarterly dividend can affect call pricing and early assignment risk Lower dividend yield; less early-assignment concern on calls
Best screener emphasis Screen around macro catalysts and broad Volume Profile shifts Screen around individual mega-cap earnings dates and tech-sector volatility

Key takeaway: If you run one universal screen for both tickers, you’ll likely over-filter QQQ (rejecting normal IV levels because they look “high” relative to SPY’s baseline) or under-filter SPY (missing genuine volatility spikes because your thresholds were calibrated to QQQ’s higher norm). Screen them separately, or use relative IV Rank rather than a flat IV number.

Common Options Screener Mistakes to Avoid

  1. Skipping liquidity filters. A high-probability trade with no open interest just means a bad fill or a hard exit.
  2. Chasing yield without checking IV Rank. A juicy premium is often juicy because IV is genuinely elevated — not because it’s a bargain.
  3. Ignoring the earnings calendar. Screening without an earnings-date filter can put you in a position right before a volatility crush or a gap.
  4. Treating screener output as a finished trade. It narrows the list; it doesn’t replace checking the chart, Relative Strength Index (RSI), or Moving Averages.
  5. Over-filtering. Stacking eight criteria at once often returns zero results. Start with two or three, then add layers.
  6. Using stale or delayed data for fast-moving strategies. A 0DTE screen built on 15-minute-delayed data can already be wrong by the time you act.

Free vs. Paid Options Screeners: What You Actually Need

Feature Free Screeners (broker platforms, Barchart, etc.) Paid/Dedicated Screeners
Basic filters (strike, expiration, volume) Yes Yes
Real-time data Often delayed 15-20 minutes Usually real-time or near-real-time
IV Rank / IV Percentile Rarely available Commonly included
Earnings-date proximity filters Limited Common
Custom saved screens Sometimes Usually
Cost $0 Subscription-based

For a handful of trades a week on SPY and QQQ, a broker’s built-in screener paired with the LVGS framework above is often enough. Active traders running multiple strategies across expirations tend to outgrow free tools faster, since delayed data and thin filter sets become a real limitation.

Learn to Trade SPY & QQQ Options with MySpyOptions

A screener is only as useful as the strategy behind it. Knowing that a contract has 0.25 delta and an IV Rank of 60 doesn’t tell you whether that setup fits your account size, risk tolerance, or the current market regime — that judgment comes from structured practice, not a filter list.

This is the gap MySpyOptions was built to close. Rather than teaching generic options theory, the platform focuses specifically on SPY and QQQ — the two most heavily traded, most liquid underlyings for retail options traders — so every lesson maps directly onto trades you can actually screen for and place. Traders working through structured, strategy-specific material tend to build consistency faster than those piecing together fragments from forums and generic courses, since position sizing, risk-to-reward framing, and Stop-Loss discipline are taught together rather than in isolation.

Why Choose MySpyOptions

Moving from “I found a contract on a screener” to “I understand why this trade fits my plan” takes a repeatable process, realistic risk framing, and feedback from traders working the same instruments. MySpyOptions is built around those three pillars:

  • Focused curriculum on SPY and QQQ specifically, rather than every optionable stock in the market.
  • Practical strategy walkthroughs that connect screener criteria (delta, IV Rank, DTE) to real trade construction and position sizing, not just theory.
  • Trader support — access to experienced traders and a community working through the same setups, without leaning on exaggerated performance claims.

The goal isn’t a shortcut. It’s structured education that shortens the distance between “I ran a screen” and “I understand why this trade made sense.”

Key Takeaways

  • An options screener filters the options market by criteria like Delta, IV Rank, Open Interest, and DTE so you’re evaluating a shortlist instead of an entire chain.
  • Liquidity filters (Open Interest, bid-ask spread) should always be applied first — a statistically attractive contract is worthless if you can’t get filled.
  • SPY and QQQ have different baseline volatility and sector exposure, so calibrate filters separately rather than using one universal screen for both.
  • The LVGS framework (Liquidity → Volatility → Greeks → Strategy) gives you a repeatable, defensible process instead of randomly stacking filters.
  • A screener narrows candidates; it does not replace chart review, risk management, or an understanding of upcoming catalysts like earnings or FOMC meetings.

Frequently Asked Questions

Is an options screener the same as an options chain?
No. An options chain is the full, unfiltered list of every strike and expiration for one underlying. A screener applies filters across one or many underlyings and returns only matching contracts.

What’s the best options screener for beginners?
A basic built-in screener (thinkorswim’s Option Hacker or Tastytrade’s screener, for example) is usually sufficient for a small watchlist like SPY and QQQ. Add a dedicated tool later if you need IV Rank, earnings filters, or real-time data across a broader universe.

Can an options screener guarantee a profitable trade?
No. It narrows a large dataset by quantitative criteria only — it doesn’t account for upcoming news, broader market context, or your personal risk tolerance, which still require manual review.

What delta range should I use for premium-selling strategies?
Many premium sellers target roughly 0.15-0.30 delta on the short strike, corresponding to a lower probability of finishing in-the-money, though the exact range depends on risk tolerance and account size.

Why does my options screener return zero results?
Usually too many filters stacked at once, or ranges set too narrow. Start with liquidity and one directional filter, then add volatility or strategy criteria incrementally.

Should I use the same screener settings for SPY and QQQ?
Not ideally. QQQ typically runs a higher baseline implied volatility than SPY due to its tech-heavy composition, so a flat IV filter calibrated to one often misclassifies the other. Use IV Rank relative to each ticker’s own history instead.

Do free options screeners use real-time data?
Not always. Many free tools use data delayed 15-20 minutes. For fast-moving strategies like 0DTE trading, that delay can change which contracts still qualify by the time you act.


Categories
Options Trading

How Options Greeks Work Together in Real Trades

Most beginner traders learn delta, theta, vega, and gamma as four separate flashcards — then get confused when a trade with “good delta” still loses money. That confusion almost always comes down to one thing: an options greeks strategy only works when you evaluate the Greeks together, not one at a time. Delta tells you direction, gamma tells you how fast that direction can change, theta tells you what time is costing or paying you, and vega tells you how much implied volatility shifts are moving the price underneath all of it. In a real SPY or QQQ trade, all four are acting on your position simultaneously — which is exactly why a stock moving in your favor can still produce a loss.

This guide walks through how the Greeks interact in practice, not just in isolation, and gives you a repeatable way to read a position before you enter it — the kind of framework experienced SPY and QQQ traders actually use, not just textbook definitions.

What Are the Options Greeks, and Why Do They Need to Be Read Together?

In short: The options Greeks — delta, gamma, theta, and vega — are sensitivity measures that show how an option’s price reacts to changes in the underlying stock price, time, and implied volatility. No single Greek tells the full story; a complete options greeks strategy reads them as a combined picture, because they move simultaneously in every real trade.

Here’s the quick reference:

  • Delta — how much the option’s price moves per $1 move in the underlying (SPY or QQQ).
  • Gamma — how fast delta itself changes as the underlying moves (delta’s “acceleration”).
  • Theta — how much value the option loses per day simply from time passing.
  • Vega — how much the option’s price changes per 1-point change in implied volatility.

These four Greeks were formalized through option pricing models built on the Black-Scholes framework, and they remain the standard vocabulary options traders use to describe risk today. Individually, each Greek answers a narrow question. Combined, they answer the question that actually matters: what does this position need to happen for me to profit, and what can quietly work against me even if I’m directionally right?

Key Takeaway: A trade can have a favorable delta and still lose money if theta decay and a vega-driven drop in implied volatility outweigh the directional gain. Reading Greeks in isolation is the single most common reason retail options trades underperform expectations.

Delta and Gamma: Direction and Its Acceleration

In short: Delta measures directional exposure; gamma measures how quickly that directional exposure changes. Together, they describe not just where your position is now, but how unstable that position becomes as SPY or QQQ moves — which is especially important for short-dated and at-the-money contracts.

A SPY call with a 0.50 delta will gain roughly $0.50 for every $1 SPY rises — at that instant. But gamma determines whether that delta stays near 0.50 or accelerates toward 0.80 as SPY continues climbing. High gamma means the position’s directional sensitivity is unstable; low gamma means it’s relatively steady.

This relationship flips depending on which side of the trade you’re on:

  • Long options (calls or puts you own) have positive gamma — acceleration works in your favor as the trade moves your way.
  • Short options (calls or puts you’ve sold) have negative gamma — acceleration works against you, which is why short premium positions can lose money quickly during a fast move even though theta is working in your favor day to day.

Gamma is also highest for at-the-money contracts and grows sharply as expiration approaches — a big reason 0DTE SPY and QQQ contracts can behave so differently in their final hours compared to earlier in the day.

Theta: The Clock That Never Stops Running

In short: Theta measures how much an option loses in value each day purely from time passing, all else being equal. Theta decay isn’t linear — it accelerates meaningfully in the final 30 days before expiration, and even more sharply in the final week, which changes how delta and gamma should be weighed as expiration nears.

For option buyers, theta is a daily cost — a constant headwind that requires the underlying to move enough, and fast enough, to outrun decay. For option sellers, theta is the primary source of profit in range-bound conditions, which is why credit spreads and iron condors are often called “theta strategies.”

The interaction with delta and gamma matters here: a long call with strong delta exposure can still lose money if SPY drifts sideways for a week, because theta erodes the option’s value daily regardless of direction. This is the single most common trap for new options buyers — correctly predicting direction but losing money anyway because the move didn’t happen fast enough to outpace time decay.

Vega: The Volatility Wildcard

In short: Vega measures how much an option’s price changes for each one-point move in implied volatility, independent of the underlying’s actual price movement. Vega matters most around earnings, Federal Reserve announcements, and other scheduled volatility events, where implied volatility can collapse even if the stock or index moves in the trader’s favor.

This is where many retail traders get blindsided. Implied volatility often drops sharply right after an anticipated event (a phenomenon commonly called “IV crush”), which can cause an option to lose value even when the underlying price direction was called correctly. A trader who buys QQQ calls heading into a Federal Reserve rate decision, expecting a rally, can still lose money if the NASDAQ-100 Index rises modestly while implied volatility collapses — because the vega-driven loss outweighs the delta-driven gain.

Bottom Line: Vega is the Greek most likely to work independently of your trade thesis being “right.” Direction and volatility are two different bets, and conflating them is a common source of avoidable losses.

How the Four Greeks Interact in a Real SPY Trade

In short: In any live position, delta, gamma, theta, and vega are acting simultaneously — not in sequence. A single price move in SPY changes your delta exposure (via gamma), costs you a day of theta regardless of direction, and may be accompanied by a shift in implied volatility that adds to or subtracts from your P&L independently.

Consider a simplified scenario: a trader buys an at-the-money SPY call ahead of a Consumer Price Index (CPI) report, two weeks from expiration.

  1. Delta initially suggests the option gains roughly $0.50 for every $1 SPY rises.
  2. Gamma means that as SPY continues rising, delta increases — each subsequent dollar move contributes more to the option’s value than the last.
  3. Theta is quietly reducing the option’s value every day the trade is held, whether SPY moves or not.
  4. Vega determines what happens to the option’s price the moment CPI data is released and implied volatility either spikes (if the number surprises) or collapses (if the report confirms expectations and uncertainty resolves).

If SPY rises 1% after the report but implied volatility collapses because the “uncertainty premium” has resolved, the vega-driven loss can offset — or even exceed — the delta-driven gain. This is precisely why professional and experienced retail traders evaluate all four Greeks together before entering a trade, rather than anchoring on delta alone.

Comparison: How Each Greek Behaves for Buyers vs. Sellers

Greek Option Buyer (Long) Option Seller (Short)
Delta Directional exposure matches position (long call = positive delta) Directional exposure is inverted (short call = negative delta)
Gamma Positive — acceleration works in your favor Negative — acceleration works against you
Theta Negative — time decay is a daily cost Positive — time decay is a daily benefit
Vega Positive — rising IV helps, falling IV (IV crush) hurts Negative — falling IV helps, rising IV hurts
Best condition Fast, sustained directional moves; rising IV Range-bound price action; falling or stable IV

A Practical Framework: Reading All Four Greeks Before You Enter a Trade

In short: Rather than checking delta and calling it done, use this four-question checklist before entering any SPY or QQQ options trade. It forces you to consider direction, acceleration, time cost, and volatility exposure as one combined picture — the foundation of a disciplined options greeks strategy.

This is an original framework built specifically for retail SPY/QQQ traders, not a repackaged textbook list.

  1. What does delta tell me about my directional exposure right now? Confirm the position’s current directional bias matches your actual market thesis — not just “bullish” or “bearish,” but by how much.
  2. What does gamma tell me about how unstable that exposure is? Ask whether you’re near the money with limited time left, where gamma can meaningfully change your delta exposure within the same session.
  3. What is theta costing (or paying) me, and does my thesis have enough time to play out? A directionally correct thesis can still lose if theta erodes value faster than the move develops — especially relevant for short-dated SPY and QQQ contracts.
  4. What is vega doing around any scheduled event, and am I being compensated for taking that volatility risk? Before earnings, CPI, or Federal Reserve announcements, separate your directional bet from your volatility bet — they are not the same trade.

Key Takeaway: A position that passes all four checks is far more resilient than one that “looks good on delta.” Most losing trades that “should have worked” fail one of the other three checks instead.

Common Mistakes Traders Make When Reading the Greeks

  • Fixating on delta alone and ignoring how gamma will change that delta as the underlying moves, especially in short-dated contracts.
  • Buying options right before high-IV events without accounting for vega-driven IV crush after the news is released.
  • Holding long options too close to expiration, letting theta decay outpace the directional move even when the trade thesis is correct.
  • Selling premium without respecting gamma risk, underestimating how quickly a fast move can hurt a negative-gamma position despite theta working in the seller’s favor day to day.
  • Treating the Greeks as static numbers rather than values that shift constantly with price, time, and implied volatility — often checked once at entry and never revisited.

Using the Greeks Alongside Technical Analysis

The Greeks describe an option’s sensitivities, but they don’t tell you where SPY or QQQ is likely to go — that’s the role of technical analysis. Many traders combine Greek-based position structuring with tools like moving averages, the Relative Strength Index (RSI), MACD, VWAP, and volume profile to time entries, while using delta, gamma, theta, and vega to determine which strike, expiration, and structure best express that view with an acceptable risk-to-reward ratio. Position sizing and stop-loss orders remain essential regardless of how favorable the Greeks look on paper — the Greeks describe sensitivity, not certainty.

Learn Practical Options Greeks Strategy with MySpyOptions

Understanding what each Greek measures is a start. Recognizing how they interact on a live SPY or QQQ chart, under real time pressure, is a different skill entirely — and it’s usually the gap between traders who understand the theory and traders who consistently execute well. Most retail traders don’t lose money because they don’t know what delta or vega mean; they lose money because they never learned to weigh all four Greeks together before clicking “buy” or “sell.”

That’s the gap MySpyOptions is built to close. Rather than teaching the Greeks as abstract definitions, MySpyOptions focuses on how they show up in real SPY and QQQ trades — reading delta and gamma together before entry, recognizing when theta decay is working against a thesis, and understanding when a trade is really a volatility bet in disguise. Structured education matters here because the Greeks interact constantly; traders who’ve practiced reading them together, guided by experienced traders, tend to build far more consistent decision-making habits than those piecing it together from scattered articles.

Why Choose MySpyOptions

MySpyOptions focuses specifically on SPY and QQQ options rather than spreading thin across the entire market, which means every lesson on the Greeks is grounded in the two underlyings retail traders actually use most. The emphasis is on practical application — reading delta, gamma, theta, and vega as one combined picture, not isolated numbers — along with ongoing trader support and risk management habits, rather than one-off tips disconnected from a broader process. For traders who want to move from “I know what the Greeks mean” to “I can read a position correctly before I enter it,” that structured, SPY/QQQ-focused approach is the difference-maker.

Frequently Asked Questions

What are the four main options Greeks?
The four primary Greeks are delta (directional exposure), gamma (how fast delta changes), theta (time decay), and vega (sensitivity to implied volatility). A fifth, rho (interest rate sensitivity), is typically a smaller consideration for short-dated retail trades.

Why can a trade lose money even if I predicted the direction correctly?
Because delta is only one of four forces acting on the option’s price. Theta decay can erode value while you wait, and a drop in implied volatility (a negative vega effect) can offset or exceed the gain from being directionally correct.

How do delta and gamma work together?
Delta shows your current directional exposure; gamma shows how quickly that exposure will change as the underlying moves. High gamma means delta can shift substantially within the same session, which is especially relevant for at-the-money, short-dated SPY and QQQ options.

What is IV crush and which Greek does it relate to?
IV crush refers to a sharp drop in implied volatility, often right after an earnings report or major economic release, and it’s measured by vega. It can cause an option to lose value even when the underlying moved in the direction the trader expected.

Do professional traders weigh all the Greeks equally?
No — the relevant weighting depends on the strategy and time horizon. Premium sellers often prioritize theta and gamma risk, while traders holding options through an event tend to prioritize vega. Delta typically remains the starting point, but rarely the only consideration.

Is it necessary to calculate the Greeks manually before every trade?
No. Most options platforms and brokers display delta, gamma, theta, and vega directly on the options chain. The skill isn’t calculating them — it’s learning to read all four together and understand how they’ll interact with your specific trade’s time horizon and market conditions.


Categories
Options Trading

Gamma Risk Explained for Options Traders

Most traders learn delta first, ignore gamma, and only discover gamma risk the hard way — usually on a 0DTE SPY trade that “should have worked” but blew through their stop in minutes. Gamma risk is the risk that an option’s delta changes faster than you expect as the underlying price moves, catching traders on the wrong side of a suddenly bigger (or smaller) position. It matters most for at-the-money options with little time left, which is exactly the profile of the SPY and QQQ contracts retail traders trade every single day. Understanding gamma risk isn’t optional anymore — with same-day expiration (0DTE) contracts now making up a majority of S&P 500-linked options volume, gamma has become one of the biggest forces moving intraday price action, not just an academic Greek.

This guide breaks gamma risk down from first principles, shows how it behaves differently for buyers versus sellers, and gives you a practical framework for sizing and managing it in real SPY and QQQ trades.

What Is Gamma Risk in Options Trading?

In short: Gamma risk is the risk that comes from delta changing quickly. Delta tells you how much an option’s price moves per $1 move in the underlying; gamma tells you how fast delta itself changes. When gamma is high, a small move in SPY or QQQ can suddenly turn a small position into a large one — or vice versa — which is why gamma is often called a “second-order” or acceleration risk.

Think of delta as speed and gamma as acceleration. A car’s speed (delta) tells you how fast you’re covering ground right now. Acceleration (gamma) tells you how quickly that speed is changing. A trader who only watches delta is watching the speedometer while ignoring the fact that the car is slamming on the gas.

Gamma risk applies to every option, but it isn’t distributed evenly:

  • At-the-money (ATM) options have the highest gamma.
  • Out-of-the-money and in-the-money options have progressively lower gamma the further they are from the current price.
  • Gamma increases sharply as expiration approaches, especially in the final hours of a 0DTE contract.
  • Long options (calls or puts you own) have positive gamma; short options (calls or puts you’ve sold) have negative gamma.

That last point is the one most beginner traders miss, and it’s the difference between gamma being your friend or your enemy.

Why Gamma Risk Matters More for SPY and QQQ Traders Specifically

In short: SPY and QQQ are the most heavily traded 0DTE underlyings in the U.S. market, which means gamma-driven dealer hedging has an outsized effect on how these two tickers actually move intraday — not just how your individual position performs.

SPY (SPDR S&P 500 ETF Trust) and QQQ (Invesco QQQ Trust, tracking the NASDAQ-100 Index) both offer options that expire every single trading day. That daily expiration cycle means there is constant demand for near-the-money, short-dated contracts — precisely the contracts where gamma is at its most extreme.

This creates two layers of gamma risk for retail traders:

  1. Position-level gamma risk — how fast your own trade’s delta is changing.
  2. Market-level gamma exposure (GEX) — how the aggregate gamma positioning of options dealers (market makers) influences SPY or QQQ’s price behavior for the whole session.

Cboe data has shown 0DTE contracts accounting for the majority of S&P 500-linked options volume in recent years, and that share has continued to grow into 2026. When dealers are net short gamma near the current price, their hedging tends to amplify moves — buying into strength and selling into weakness. When dealers are net long gamma, hedging tends to dampen moves and pull price back toward high-open-interest strikes. Neither condition tells you which direction the market will go, but both change how violently it’s likely to move once it starts.

Key Takeaway: Your gamma risk isn’t just about your own contract — it’s layered on top of a market where dealer gamma positioning already shapes how SPY and QQQ tend to behave that day. Ignoring the market-level picture while managing only your position-level gamma is like driving without checking the weather.

Long Gamma vs. Short Gamma: Two Completely Different Risk Profiles

In short: Long gamma (buying options) means acceleration works in your favor as the trade moves your way — gains compound, losses are capped. Short gamma (selling options) means acceleration works against you — losses can compound quickly if the underlying moves fast, even though you collected premium up front.

Factor Long Gamma (Option Buyer) Short Gamma (Option Seller)
Position type Long calls, long puts, debit spreads (net) Short calls, short puts, credit spreads (net), iron condors
Effect of a fast move Delta accelerates in your favor Delta accelerates against you
Best market condition Fast, trending, or volatile moves Quiet, range-bound, low-volatility conditions
Theta (time decay) Works against you Works for you
Risk near expiration Bigger potential reward if move happens Sharply rising risk of a fast adverse move
Typical retail mistake Holding too long as theta erodes value Being under-hedged into a breakout or gap

Neither side is inherently “better.” Long gamma traders pay for convexity (the ability to benefit disproportionately from a big move) through theta decay. Short gamma traders collect premium for accepting that a fast move can hurt them disproportionately. Most professional risk desks don’t think of these as competing strategies — they think of them as trade-offs to be sized, not avoided.

How Gamma Risk Behaves Near Expiration (Including 0DTE)

In short: Gamma rises exponentially in the final hours before expiration for at-the-money contracts, which is why 0DTE SPY and QQQ trades can move from a manageable loss to a maximum loss (or a small win to a home run) in a matter of minutes.

A same-day SPY option that’s at the money at 10:00 a.m. can behave completely differently by 3:30 p.m., even if SPY hasn’t moved much, simply because there’s almost no time value left to cushion the position. This is the mechanical reason 0DTE trading has a reputation for being unforgiving:

  • Theta has already decayed most of the option’s extrinsic value.
  • Gamma is doing almost all of the remaining “work” in the option’s price.
  • A move of even a few dollars in SPY can flip an option from worthless to deep in the money, or the reverse.

This is also why the concept of a gamma wall or zero-gamma level matters for intraday traders, even if you never plan to model dealer positioning yourself. Free and paid gamma-exposure (GEX) tools built on public options chain data can show approximate zones where dealer hedging is likely to be concentrated. These levels aren’t guarantees of support or resistance, but they help explain why price sometimes “pins” near a strike into the close, and why it sometimes breaks away from a level violently instead.

A Practical Gamma Risk Framework for Retail Traders

In short: Rather than avoiding gamma risk entirely, size and structure your trades based on where you sit on the gamma spectrum. Below is a simple four-step framework you can apply to any SPY or QQQ options trade before entry.

This is an original framework — not something you’ll find copy-pasted across other gamma explainers — built specifically for retail SPY/QQQ traders working with defined-risk accounts.

Step 1 — Identify your gamma exposure. Are you net long gamma (buying calls/puts, debit spreads) or net short gamma (selling premium, credit spreads, iron condors) on this specific trade?

Step 2 — Match your exposure to your time horizon. Long gamma trades need room and time to be right; they lose value every day they’re wrong. Short gamma trades need a defined max-loss and a plan for what happens if price gaps through your short strike.

Step 3 — Size for the worst plausible move, not the average one. For 0DTE and weekly SPY/QQQ trades, ask: “What does this position look like if SPY moves 1.5–2% against me in the next hour?” Position size — not stop-loss placement alone — is what protects you from a gamma-driven blowup, because fast-moving gamma can cause slippage past a stop.

Step 4 — Reassess as expiration approaches. Gamma risk on a short-dated position isn’t static. A trade that was reasonably sized at 10 a.m. can become oversized by 2 p.m. purely because gamma has grown, even if your unrealized P&L hasn’t changed much. Rolling, closing, or hedging (as discussed above) are the standard responses.

Bottom Line: Gamma risk management is a sizing and structure discipline, not a prediction discipline. You don’t need to forecast the next move — you need a position that survives whichever move actually happens.

Common Gamma Risk Mistakes Retail Traders Make

  • Selling naked short-dated options without a defined max loss, underestimating how quickly negative gamma can compound during a fast move.
  • Holding long options too close to expiration, letting theta erode value while treating gamma’s potential upside as guaranteed.
  • Ignoring position-level gamma when adding to a trade, effectively doubling exposure without realizing it.
  • Treating GEX or gamma-wall levels as precise support/resistance lines rather than probabilistic zones based on modeled dealer positioning.
  • Sizing 0DTE trades the same way as 30-45 DTE trades, despite the dramatically different gamma profile.

Managing Gamma Risk: Close, Roll, or Hedge

When a position’s gamma risk becomes uncomfortable, traders generally have three practical responses:

  1. Close the position — the simplest way to eliminate gamma risk entirely, at the cost of giving up any remaining upside.
  2. Roll the position — moving to a further-dated expiration or different strike to reduce gamma exposure while staying in the trade.
  3. Hedge the position — adding an offsetting options or stock position to reduce net gamma, commonly used by more active traders and market makers alike.

For most retail SPY/QQQ traders, closing or rolling is more practical than active gamma hedging, which typically requires frequent monitoring and transaction costs that can outweigh the benefit on smaller accounts.

Learn Practical SPY and QQQ Options Trading with MySpyOptions

Understanding gamma risk in a blog post is one thing. Recognizing it in real time, on a live SPY chart, with your own capital on the line, is another. That gap between knowing the concept and applying it under pressure is where most retail traders get hurt — not because they don’t understand what gamma is, but because they haven’t practiced sizing and managing it in real market conditions.

That’s the gap MySpyOptions is built to close. Rather than teaching Greeks in isolation, MySpyOptions focuses on how concepts like gamma risk actually show up in SPY and QQQ trading — position sizing around expiration, recognizing when a trade’s risk profile has shifted intraday, and building consistent habits around defined-risk structures. Structured education matters here because gamma risk is unforgiving of guesswork; traders who’ve walked through real examples with experienced traders tend to size and adjust positions with far more discipline than those learning purely from theory.

Why Choose MySpyOptions

MySpyOptions focuses specifically on SPY and QQQ options — the two most actively traded, 0DTE-eligible underlyings retail traders use — rather than spreading thin across every ticker on the market. The emphasis is on practical strategy application, risk management habits (including how to think about gamma, theta, and position sizing together), and ongoing trader support, rather than one-off tips disconnected from a broader trading process. For traders who want to move from “I understand what gamma is” to “I know how to size around it,” that structured, SPY/QQQ-focused approach is the difference-maker.

Frequently Asked Questions

What is gamma risk in simple terms?
Gamma risk is the risk that an option’s delta changes faster than expected as the underlying price moves. High gamma means a small price move can significantly change how much your position gains or loses, especially for at-the-money, short-dated options.

Is gamma risk higher for option buyers or sellers?
Both face gamma risk, but it affects them differently. Buyers have positive gamma, so fast moves tend to help them. Sellers have negative gamma, so fast moves tend to hurt them — even though sellers usually have theta decay working in their favor day to day.

Why is gamma risk so extreme in 0DTE SPY and QQQ options?
Because gamma rises sharply as expiration approaches for at-the-money contracts. With little or no time value left, gamma does most of the work in determining how the option’s price reacts to even small moves in SPY or QQQ.

How do I reduce gamma risk in my options trades?
The three standard responses are closing the position, rolling it to a later expiration or different strike, or hedging it with an offsetting options or stock position. Sizing trades appropriately from the start is the most reliable way to keep gamma risk manageable.

Does gamma exposure (GEX) predict where SPY will go?
No. GEX estimates how dealer hedging flows might influence volatility and key price levels — it doesn’t predict direction. Positive gamma zones tend to be associated with calmer, mean-reverting price action; negative gamma zones tend to be associated with more volatile, momentum-driven action.

Can gamma risk cause losses even if I have a stop-loss order?
Yes. In fast-moving, high-gamma conditions, price can gap or move quickly enough that a stop-loss order fills at a worse price than intended (slippage). This is why position sizing, not stop placement alone, is the primary defense against gamma-driven losses.