
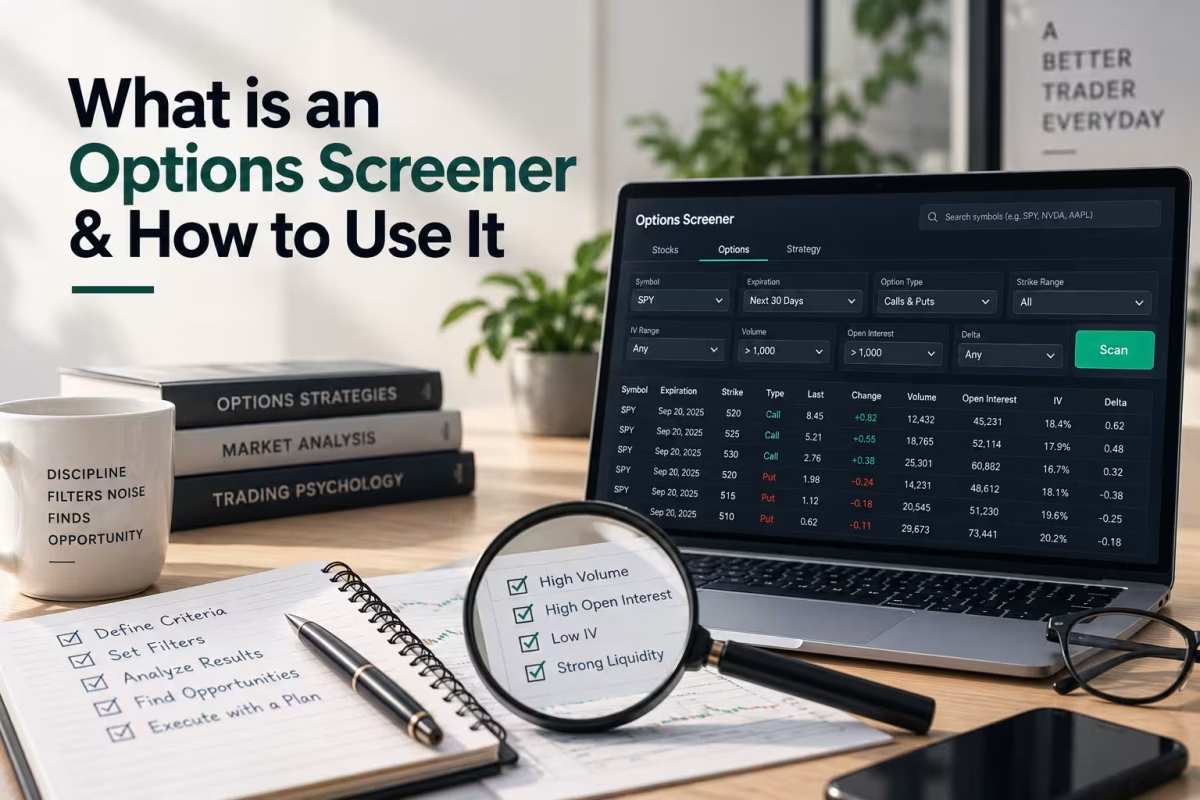
An options screener is a filtering tool that scans thousands of live options contracts and narrows them down to the handful that match criteria you set — things like delta, implied volatility, open interest, and days to expiration. Instead of scrolling through a bloated options chain one strike at a time, you tell the screener what a “good” trade looks like, and it hands you a short, rankable list.
For SPY and QQQ traders specifically, this matters more than for random small-cap tickers. Both symbols have thousands of active strikes across dozens of weekly and monthly expirations — finding a 0.20-delta put 35 days out with tight spreads means clicking through a chain that can run 300+ rows deep. A screener does that in seconds.
This guide covers how options screeners work, which filters actually move the needle, a step-by-step framework for using one, and where SPY and QQQ screening diverges from screening individual stocks.
What Is an Options Screener, Exactly?
In short: An options screener is a search-and-filter engine for the options market. You input criteria — strike, expiration, delta, IV rank, volume — and it returns only the contracts that satisfy every condition, ranked however you choose.
Think of it as a search engine, but for derivatives instead of web pages. Google filters billions of pages down to ten results based on relevance. An options screener filters a market with well over a million listed contracts down to a shortlist you can actually evaluate by hand.
The core inputs behind almost every options screener are the same:
- Underlying and strategy type — single-leg calls/puts, spreads, or multi-leg structures
- Expiration window — 0DTE, weekly, 30-45 days to expiration (DTE), or LEAPS
- Strike selection — in-the-money, at-the-money, or out-of-the-money
- The Greeks — Delta, Theta, Gamma, and Vega
- Volatility metrics — Implied Volatility (IV) and IV Rank
- Liquidity metrics — Open Interest and Volume
A screener doesn’t pick trades for you. It removes the 99% of contracts that don’t fit your strategy so you can spend your research time on the 1% that might.
How Does an Options Screener Actually Work?
In short: A screener pulls live data from the options chain, applies your filters as sequential logic conditions (delta between X and Y, IV rank above Z, expiration within a window), and returns matching contracts sorted by whatever column you choose.
Under the hood, the process runs in three steps: data ingestion (pulling live or delayed pricing, Greeks, and volume/open interest across every optionable underlying or a watchlist like SPY and QQQ), filter application (each criterion acts like a database query — “Delta between 0.15 and 0.30 AND DTE between 30 and 45”), and ranking (results populate a sortable table by yield, volume, IV Rank, or risk-to-reward).
Most retail brokers offer a basic version inside their trading platform (thinkorswim’s Option Hacker and Tastytrade’s screener are common examples), while dedicated screening tools add deeper filters like earnings proximity, unusual options activity, or IV percentile ranking that broker platforms often lack.
Key Options Screener Filters You Need to Know
Not every filter matters equally. Here’s the breakdown of what consistently separates a useful screen from a noisy one.
| Filter | What It Measures | Why It Matters |
| Delta | Rate of option price change per $1 move in the underlying; doubles as a rough probability of expiring in-the-money | Sets your directional exposure and approximate win-rate for premium-selling strategies |
| Theta | Rate of time decay per day | Sellers want higher theta; buyers want to minimize its drag |
| Gamma | Rate of change in delta itself | Critical for short-dated and 0DTE positions where delta shifts fast |
| Vega | Sensitivity to a 1-point change in implied volatility | Tells you how much a position gains or loses purely from IV expansion or contraction |
| Implied Volatility (IV) | The market’s forward-looking estimate of price movement | High IV inflates premium; screening for it helps premium sellers find “expensive” options |
| IV Rank / IV Percentile | Where current IV sits relative to its own 52-week range | Prevents you from selling “high” IV that’s actually low compared to that ticker’s history |
| Open Interest (OI) | Total outstanding contracts at a strike | Low OI often means wide spreads and difficulty exiting a position |
| Volume | Contracts traded that session | Confirms a strike is actively traded, not just theoretically listed |
| Days to Expiration (DTE) | Time remaining until the contract expires | Determines your theta decay rate and total risk exposure window |
| Bid-Ask Spread | Difference between the buy and sell price | A wide spread (often flagged as a percentage of the mid-price) increases slippage cost |
Bottom line: Delta and DTE set your strategic exposure. IV and IV Rank tell you whether options are cheap or expensive. Open Interest and spread width tell you whether you can actually get filled at a fair price. Skipping the liquidity filters is the single most common screener mistake — a trade can look statistically perfect and still be untradeable if nobody else is in it.
A Step-by-Step Framework for Using an Options Screener
Rather than randomly stacking filters, run every screen through this four-layer sequence. It’s the same order professional desks tend to apply filters in, and it prevents you from optimizing for a metric (like yield) that turns out to be untradeable.
The Liquidity-Volatility-Greeks-Strategy (LVGS) Framework:
- Liquidity layer (filter first, always). Set minimum Open Interest (commonly 100+ contracts for SPY/QQQ strikes) and cap the bid-ask spread. This eliminates untradeable contracts before you waste time analyzing them.
- Volatility layer. Decide whether you want high IV Rank (favors premium-selling strategies like credit spreads and covered calls) or low IV (favors long calls, puts, or debit spreads). Set your IV Rank range accordingly.
- Greeks layer. Narrow by Delta to match your risk tolerance and directional view, then check Theta and Gamma to confirm the decay profile and short-term risk fit your holding period.
- Strategy layer. Apply the structural criteria specific to your strategy — DTE window, strike width for spreads, or earnings-date proximity — and sort the shortlist by risk-to-reward ratio.
Mini example (SPY, hypothetical, for illustration only): SPY is near $580 and you want a 30-45 DTE put credit spread. The liquidity layer leaves strikes with tight spreads and 500+ open interest. The volatility layer flags an IV Rank of 55 — tradeable for premium selling. The Greeks layer narrows you to short puts around 0.20-0.25 delta. The strategy layer ranks what’s left by risk-to-reward, leaving two or three spreads worth verifying against the chart and any upcoming Federal Open Market Committee (FOMC) dates — never traded blind off the screener alone.
This is where a screener’s real value shows up: it doesn’t replace judgment, but it stops you from manually eyeballing 40 strikes to find the two worth a second look.
Options Screener for SPY vs. QQQ: What’s Actually Different
Most screener guides treat every underlying the same way. SPY and QQQ behave differently enough that your filter settings shouldn’t be identical.
| Factor | SPDR S&P 500 ETF Trust (SPY) | Invesco QQQ Trust (QQQ) |
| Underlying index | S&P 500 (500 large-cap U.S. stocks across sectors) | NASDAQ-100 Index (100 largest non-financial NASDAQ companies) |
| Sector concentration | Broadly diversified across 11 sectors | Heavily weighted toward technology and growth names |
| Typical IV behavior | Generally lower baseline IV; spikes around macro events (CPI, FOMC) | Generally higher baseline IV; more sensitive to mega-cap tech earnings |
| Dividend impact on options pricing | Quarterly dividend can affect call pricing and early assignment risk | Lower dividend yield; less early-assignment concern on calls |
| Best screener emphasis | Screen around macro catalysts and broad Volume Profile shifts | Screen around individual mega-cap earnings dates and tech-sector volatility |
Key takeaway: If you run one universal screen for both tickers, you’ll likely over-filter QQQ (rejecting normal IV levels because they look “high” relative to SPY’s baseline) or under-filter SPY (missing genuine volatility spikes because your thresholds were calibrated to QQQ’s higher norm). Screen them separately, or use relative IV Rank rather than a flat IV number.
Common Options Screener Mistakes to Avoid
- Skipping liquidity filters. A high-probability trade with no open interest just means a bad fill or a hard exit.
- Chasing yield without checking IV Rank. A juicy premium is often juicy because IV is genuinely elevated — not because it’s a bargain.
- Ignoring the earnings calendar. Screening without an earnings-date filter can put you in a position right before a volatility crush or a gap.
- Treating screener output as a finished trade. It narrows the list; it doesn’t replace checking the chart, Relative Strength Index (RSI), or Moving Averages.
- Over-filtering. Stacking eight criteria at once often returns zero results. Start with two or three, then add layers.
- Using stale or delayed data for fast-moving strategies. A 0DTE screen built on 15-minute-delayed data can already be wrong by the time you act.
Free vs. Paid Options Screeners: What You Actually Need
| Feature | Free Screeners (broker platforms, Barchart, etc.) | Paid/Dedicated Screeners |
| Basic filters (strike, expiration, volume) | Yes | Yes |
| Real-time data | Often delayed 15-20 minutes | Usually real-time or near-real-time |
| IV Rank / IV Percentile | Rarely available | Commonly included |
| Earnings-date proximity filters | Limited | Common |
| Custom saved screens | Sometimes | Usually |
| Cost | $0 | Subscription-based |
For a handful of trades a week on SPY and QQQ, a broker’s built-in screener paired with the LVGS framework above is often enough. Active traders running multiple strategies across expirations tend to outgrow free tools faster, since delayed data and thin filter sets become a real limitation.
Learn to Trade SPY & QQQ Options with MySpyOptions
A screener is only as useful as the strategy behind it. Knowing that a contract has 0.25 delta and an IV Rank of 60 doesn’t tell you whether that setup fits your account size, risk tolerance, or the current market regime — that judgment comes from structured practice, not a filter list.
This is the gap MySpyOptions was built to close. Rather than teaching generic options theory, the platform focuses specifically on SPY and QQQ — the two most heavily traded, most liquid underlyings for retail options traders — so every lesson maps directly onto trades you can actually screen for and place. Traders working through structured, strategy-specific material tend to build consistency faster than those piecing together fragments from forums and generic courses, since position sizing, risk-to-reward framing, and Stop-Loss discipline are taught together rather than in isolation.
Why Choose MySpyOptions
Moving from “I found a contract on a screener” to “I understand why this trade fits my plan” takes a repeatable process, realistic risk framing, and feedback from traders working the same instruments. MySpyOptions is built around those three pillars:
- Focused curriculum on SPY and QQQ specifically, rather than every optionable stock in the market.
- Practical strategy walkthroughs that connect screener criteria (delta, IV Rank, DTE) to real trade construction and position sizing, not just theory.
- Trader support — access to experienced traders and a community working through the same setups, without leaning on exaggerated performance claims.
The goal isn’t a shortcut. It’s structured education that shortens the distance between “I ran a screen” and “I understand why this trade made sense.”
Key Takeaways
- An options screener filters the options market by criteria like Delta, IV Rank, Open Interest, and DTE so you’re evaluating a shortlist instead of an entire chain.
- Liquidity filters (Open Interest, bid-ask spread) should always be applied first — a statistically attractive contract is worthless if you can’t get filled.
- SPY and QQQ have different baseline volatility and sector exposure, so calibrate filters separately rather than using one universal screen for both.
- The LVGS framework (Liquidity → Volatility → Greeks → Strategy) gives you a repeatable, defensible process instead of randomly stacking filters.
- A screener narrows candidates; it does not replace chart review, risk management, or an understanding of upcoming catalysts like earnings or FOMC meetings.
Frequently Asked Questions
Is an options screener the same as an options chain?
No. An options chain is the full, unfiltered list of every strike and expiration for one underlying. A screener applies filters across one or many underlyings and returns only matching contracts.
What’s the best options screener for beginners?
A basic built-in screener (thinkorswim’s Option Hacker or Tastytrade’s screener, for example) is usually sufficient for a small watchlist like SPY and QQQ. Add a dedicated tool later if you need IV Rank, earnings filters, or real-time data across a broader universe.
Can an options screener guarantee a profitable trade?
No. It narrows a large dataset by quantitative criteria only — it doesn’t account for upcoming news, broader market context, or your personal risk tolerance, which still require manual review.
What delta range should I use for premium-selling strategies?
Many premium sellers target roughly 0.15-0.30 delta on the short strike, corresponding to a lower probability of finishing in-the-money, though the exact range depends on risk tolerance and account size.
Why does my options screener return zero results?
Usually too many filters stacked at once, or ranges set too narrow. Start with liquidity and one directional filter, then add volatility or strategy criteria incrementally.
Should I use the same screener settings for SPY and QQQ?
Not ideally. QQQ typically runs a higher baseline implied volatility than SPY due to its tech-heavy composition, so a flat IV filter calibrated to one often misclassifies the other. Use IV Rank relative to each ticker’s own history instead.
Do free options screeners use real-time data?
Not always. Many free tools use data delayed 15-20 minutes. For fast-moving strategies like 0DTE trading, that delay can change which contracts still qualify by the time you act.