
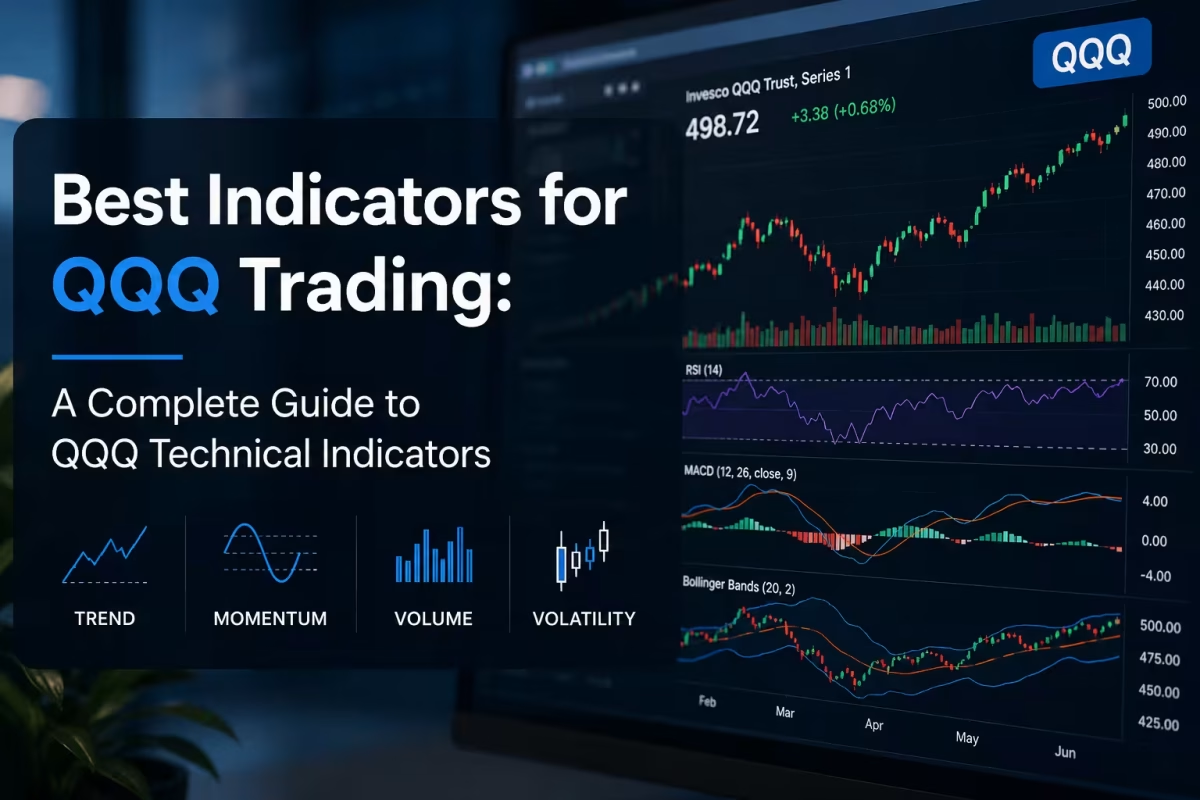
If you’ve spent any time trading options on the Invesco QQQ Trust, you already know it doesn’t move like a sleepy index fund. QQQ tracks the Nasdaq-100, which means tech-heavy swings, sharper reversals, and premiums that can evaporate faster than you’d like. That volatility is exactly why traders search for the best indicators for QQQ trading in the first place — the right signals can be the difference between catching a real move and getting chopped up by noise.
Here’s the part most guides skip: no single indicator for QQQ trading will make you consistently profitable on its own. Ask ten experienced traders which QQQ technical indicators they trust, and you’ll get ten slightly different stacks — but almost all of them combine trend, momentum, volume, and volatility signals rather than leaning on one number.
This guide walks through the eight indicators that show up most often in serious QQQ trading plans, explains what each one is actually telling you, and lays out a simple framework for combining them instead of chasing single signals.
Why Technical Indicators Matter for QQQ Options
Options don’t just care about direction. They’re also racing against time decay (Theta) and reacting to shifts in implied volatility — so timing matters more here than it does for a plain stock trade.
A good indicator helps you answer questions like:
- Is this trend strong enough to actually trade, or is it running out of steam?
- Is momentum building or fading right now?
- Are buyers or sellers actually in control at this level?
- Is this breakout backed by real volume, or is it a trap?
None of these tools predict the future. What they do is stack the odds — turning a gut-feel entry into a more defensible, repeatable decision.
Why One Signal Isn’t Enough
A lot of newer traders buy calls the moment RSI crosses 50, or the second price pokes above a moving average. It feels like confirmation. Usually it’s just noise.
What separates a disciplined setup from a guess is confluence — several indicators agreeing at once. A stronger bullish case for QQQ might look like:
- Price holding above the 20-day EMA
- MACD flipping to a bullish crossover
- RSI climbing past 55 without looking stretched
- Volume picking up as the breakout happens
Each of those is a different lens on the same move. Stacked together, they tell a more convincing story than any one of them alone.
The 8 Best Indicators for QQQ Trading
The strongest QQQ technical indicators combine trend identification, momentum analysis, and volume confirmation. Most retail traders build their core toolkit around the 20 EMA, 50 EMA, RSI, MACD, VWAP, Volume Profile, ATR, and options chain analysis — and layer implied volatility on top for options-specific decisions.
1. Relative Strength Index (RSI)
RSI measures how fast and how far price has moved recently, on a 0–100 scale. Traditionally, above 70 means overbought and below 30 means oversold — but that textbook reading gets traders in trouble on QQQ specifically, because during strong Nasdaq-driven trends, RSI can sit above 70 for days. Traders who sell calls the moment RSI touches 70 often exit winners far too early.
A more useful approach for QQQ:
- Treat RSI above 50 as confirmation of bullish momentum, not a sell trigger
- Watch for RSI holding above 40 during pullbacks in an uptrend
- Look for divergence — price making a new high while RSI doesn’t — as an early warning sign
Example: QQQ breaks a well-tested resistance level, and RSI climbs from 48 to 60 as volume rises alongside it. That breakout carries a lot more weight than one where price moves but RSI barely budges.
Strengths: simple to read, good at flagging momentum shifts and divergence. Limitations: prone to false signals in strong trends and in choppy, range-bound markets.
2. Moving Averages (20 EMA & 50 EMA)
Moving averages smooth out the day-to-day noise and give you a cleaner read on trend direction — arguably the most foundational of all QQQ technical indicators.
| Market condition | What it suggests |
| Price above both the 20 EMA and 50 MA | Bullish trend |
| Price below both averages | Bearish trend |
| Price whipping across both repeatedly | Sideways, low-conviction market |
The 20 EMA reacts quickly, so it’s useful for spotting short-term shifts. The 50 MA moves slower and works better as a broader trend filter.
Example: A trader eyeing QQQ calls might wait for price to hold above the 20 EMA, for the 20 EMA to sit above the 50 MA, and for price to successfully retest that average after breaking out — rather than chasing a candle that’s already run.
Strengths: cuts down on emotional, reactive trading; pairs naturally with RSI and MACD. Limitations: lagging by nature, and can whipsaw in choppy conditions.
3. MACD (Moving Average Convergence Divergence)
MACD compares two EMAs to flag momentum shifts before they’re obvious on a plain price chart. A bullish signal shows up when the MACD line crosses above the signal line and the histogram starts expanding; a bearish signal is the mirror image.
Where RSI leans toward spotting reversals, MACD is better at confirming that a trend has real legs. For QQQ options traders specifically, it’s a useful gut-check before committing capital to a breakout — is momentum actually strengthening, or is price just drifting?
4. Volume Weighted Average Price (VWAP)
VWAP tracks the average price QQQ has traded at during the session, weighted by volume — essentially, where the real money has been transacting. It’s one of the more institutionally-respected indicators because large players often use it as a benchmark for execution quality.
- Price above VWAP: buyers have the edge
- Price below VWAP: sellers are in control
- VWAP holding as support: the trend is more likely to continue
- Repeated failed attempts to hold above VWAP: momentum may be fading
Example: QQQ gaps up on a soft inflation print. Rather than chasing calls at the open, a disciplined trader waits for a pullback toward VWAP. If buyers defend that level on strong volume, it’s a much better-confirmed entry than the initial gap.
Strengths: excellent for intraday entries, closely watched by institutions. Limitations: resets daily, so it’s far less useful for multi-day swing trades.
5. Volume Profile
Volume Profile flips the usual volume chart on its side — instead of showing volume over time, it shows volume by price level, answering a genuinely different question: where has the market actually done business?
Key reference points:
- Point of Control (POC): the single price with the most volume
- High Volume Nodes (HVNs): zones where price tends to consolidate
- Low Volume Nodes (LVNs): zones price tends to move through quickly
For options traders, these levels are useful anchors for profit targets, stop placement, and gauging whether a breakout has real acceptance behind it.
6. Average True Range (ATR)
ATR measures how much QQQ typically moves in a session — not direction, just magnitude. It’s the indicator most likely to save you from a bad stop-loss placement.
If ATR is running at $6 and your stop is $1 away from entry, you’re not protecting against a trend reversal — you’re getting stopped out by completely normal intraday chop. ATR is especially useful for sizing stops, setting realistic profit targets, and calibrating position size to current volatility.
7. Options Chain Analysis
Where the indicators above explain what price is doing, the options chain explains how everyone else is positioned. Traders watching QQQ options typically track open interest, daily volume, bid-ask spread, implied volatility, delta, and gamma.
Example: a breakout paired with a sudden jump in call open interest at the next strike often points to institutional participation building behind the move. On the flip side, unusually elevated implied volatility might push a trader toward a defined-risk spread instead of a naked long call.
8. Implied Volatility (IV)
IV estimates how much the market expects QQQ to move — and it directly sets option premiums. This is where options trading diverges sharply from trading the underlying: you can be completely right on direction and still lose money if IV contracts after you enter.
Before placing a trade, it’s worth checking current IV, IV Rank relative to its own history, and whether an earnings report, CPI release, or Fed meeting is sitting on the calendar and likely to move volatility either way.
The MySpyOptions Indicator Stack™
Rather than treating these eight tools as a menu to pick from, it helps to run them through a structured process. That’s the idea behind the MySpyOptions Indicator Stack™ — four layers, checked in order, before any trade goes on.
Step 1 — Trend. Is price above the 20 EMA? Is the 20 EMA above the 50 MA? If both are true, you’re only looking for bullish setups.
Step 2 — Momentum. Does RSI sit above 50? Has MACD flipped to a bullish crossover? Momentum needs to support the trend, not fight it.
Step 3 — Confirmation. Is volume rising into the move? Is price holding above VWAP? Has old resistance flipped into new support?
Step 4 — Risk. Only now do you pick expiration, delta, position size, stop-loss, and the risk-to-reward ratio you’re willing to accept.
| Problem | Solution |
| False breakout | Wait for volume confirmation |
| Late entry | Use moving-average pullbacks instead of chasing |
| Emotional trading | Follow a written checklist, every time |
| Oversized losses | Fix position sizing and stops before entry |
| Conflicting indicators | Run the full Indicator Stack™ rather than picking favorites |
Indicator Comparison at a Glance
| Indicator | Purpose | Best For | Watch Out For |
| RSI | Momentum | Reversals & trend strength | Stays overbought in strong trends |
| 20 EMA | Short-term trend | Entries | Lags fast reversals |
| 50 MA | Primary trend | Trend confirmation | Slow to react |
| MACD | Momentum confirmation | Swing trades | Signals arrive late |
| VWAP | Institutional pricing | Day trading | Intraday only |
| Volume Profile | Support/resistance | Swing trading | Takes practice to read |
| ATR | Volatility | Stops & targets | Says nothing about direction |
| Options Chain | Positioning | Contract selection | Needs to be paired with charts |
Common Mistakes When Using QQQ Technical Indicators
Stacking too many indicators. Five indicators that disagree with each other don’t produce a better decision — they produce paralysis. One trend indicator, one momentum indicator, one confirmation tool is usually enough.
Ignoring the macro calendar. Technical signals get noisy fast around Fed announcements, CPI prints, and big tech earnings. Check the economic calendar before you trust a breakout blindly.
Trading every crossover. Not every signal deserves capital. Waiting is a position too.
Skipping risk management. Indicators find opportunities; risk management decides whether you’re still trading next month. Every trade needs a stop, a target, a position size, and a cap on how much of the account is at risk (commonly 1–2%).
Pre-Trade Checklist
Before entering any QQQ options trade, run through this:
- Trend confirmed?
- RSI supporting momentum?
- MACD agreeing with direction?
- Volume increasing?
- Price respecting VWAP or a key support level?
- ATR factored into stop placement?
- Implied volatility checked?
- Risk-to-reward at least 2:1?
If more than a couple of these come back “no,” waiting is usually the better trade.
Learn QQQ Options Trading with MySpyOptions
Reading indicators is only one piece of becoming a consistent trader. The bigger skill is combining chart analysis, options chain reading, and disciplined risk management into a process you can repeat trade after trade — not just on a good week.
MySpyOptions focuses on practical, rule-based education for SPY and QQQ traders: reading options chains, understanding the Greeks (Delta, Theta, Gamma, Vega), position sizing, and building a structured trading plan you can actually stick to. If you’re still working out the basics of calls versus puts, or want to explore faster-paced strategies like weekly options or options scalping, those guides are a natural next step from here. You can also browse the full library on the MySpyOptions blog.
Key Takeaways
The best indicators for QQQ trading aren’t the ones that look impressive on a chart — they’re the ones that complement each other. A workable process looks like this:
- Identify the trend with moving averages.
- Confirm momentum with RSI and MACD.
- Validate the move with VWAP or Volume Profile.
- Measure volatility with ATR.
- Check the options chain and implied volatility before picking a contract.
- Define your risk before you place the trade — not after.
No single indicator is going to nail every trade. Consistency comes from combining objective signals with a repeatable process and risk management you don’t skip when things get exciting.
Frequently Asked Questions
What are the best indicators for QQQ trading?
The most effective combination includes the 20 EMA, 50 MA, RSI, MACD, VWAP, Volume Profile, ATR, and options chain analysis. Used together, they cover trend, momentum, volume, and risk — a more complete picture than any single tool.
Is RSI enough on its own for trading QQQ options?
Not really. RSI is a solid momentum gauge, but pairing it with a trend and volume indicator cuts down significantly on false signals, especially during strong Nasdaq-driven runs.
Which indicator works best for day trading QQQ options?
VWAP is the go-to for intraday traders since it reflects volume-weighted average pricing and shows where institutional flow is favoring buyers or sellers.
Which QQQ technical indicators are best for swing trading?
Swing traders typically lean on the 20 EMA, 50 MA, RSI, MACD, and Volume Profile to catch sustained moves rather than intraday noise.
How many indicators should I actually use?
Three to five that complement each other is the sweet spot. Beyond that, you’re usually adding conflicting noise, not better information.